Revision history [back]
| | 1 | initial version |

As pointed out by @FrédéricC, you are using a non implemented syntax to color a curve. However, with some extra effort, you can get the intended graphic. Try this:
var("x,y,z,t")
f(x,y,z)=y-x+2*z^2

fMax=2.3; fMin=-0.3
def col(x,y,z):
    return N((f(x,y,z)-fMin)/(fMax-fMin))

xc, yc = 1/2*cos(t), 1/2*(1+sin(t))
C_1(t) = (xc, yc, sqrt(1-xc^2-yc^2))

npoints = 80
a, b = 0, 2*pi
dt = (b-a)/(npoints-1)
t_range = [a,a+dt..b]
pts = [C_1(t) for t in t_range]
colors = [colormaps.jet(col(*C_1(t))) for t in t_range]
curve = sum(line3d([pts[i],pts[i+1]], color=colors[i], radius=0.01)
            for i in range(0,len(pts)-1))
show(curve)
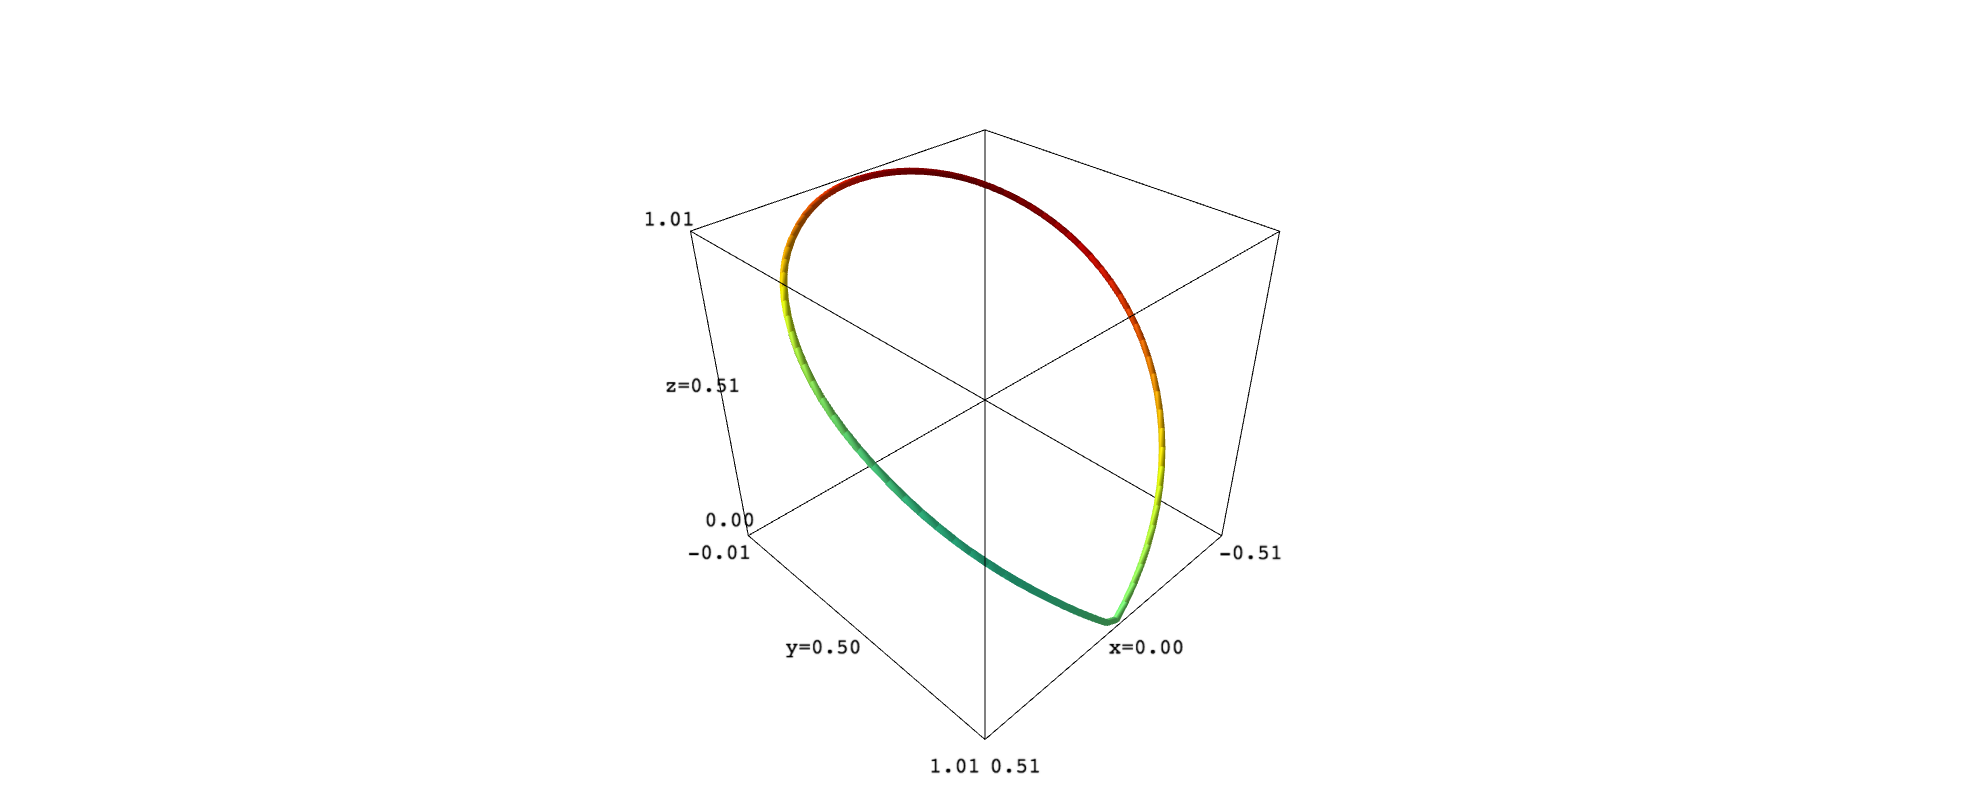
I have defined $C_1(t)$ in a slightly different way, which, IMHO, is more clear. The above code produces the following picture:
Hope that helps.
