Revision history [back]
| | 1 | initial version |
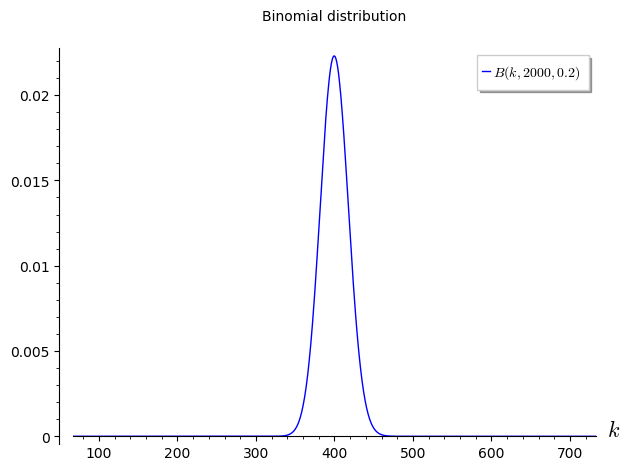
I suggest to use list_plot instead of bar_chart
sage: import scipy.stats
sage: n = 2000
sage: p = 0.2
sage: binom_dist = scipy.stats.binom(n, p)
sage: L = [binom_dist.pmf(k) for k in range(n)]
sage: kwds = dict(axes_labels=['$k$',''])
sage: kwds.update(legend_label='$B(k,{},{})$'.format(n, float(p)))
sage: kwds.update(title='Binomial distribution')
sage: m = n*p
sage: v = n*p*(1-p)
sage: list_plot(L, plotjoined=True, xmin=m-v, xmax=m+v, **kwds)
To add the bars to the plot, you may do:
sage: list_plot(L, plotjoined=True, xmin=m-v, xmax=m+v, **kwds) + bar_chart(L)
