Revision history [back]
| | 1 | initial version |
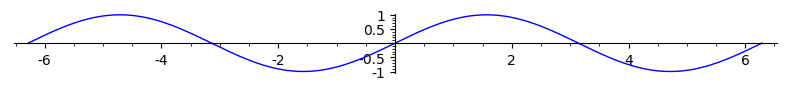
You may do:
sage: p = plot(sin(x), (x, -2*pi, 2*pi))
sage: p.show(figsize=[8,1])
to change the scaling:
The method save accepts the same argument:
sage: p.save('image.png', figsize=[8,1])
To do further changes on the figure, you may get the matplotlib object behind the 2d Graphics object and use matplotlib possibilities:
sage: figure = p.matplotlib()
sage: figure
<Figure size 640x480 with 1 Axes>
sage: axes = figure.axes[0]
| | 2 | No.2 Revision |
You may do:
sage: p = plot(sin(x), (x, -2*pi, 2*pi))
sage: p.show(figsize=[8,1])
to change the scaling:
The method save accepts the same argument:
sage: p.save('image.png', figsize=[8,1])
To do further changes on the figure, you may get the matplotlib object behind the 2d Graphics object and use matplotlib possibilities:
sage: figure = p.matplotlib()
sage: figure
<Figure size 640x480 with 1 Axes>
sage: type(figure)
<class 'matplotlib.figure.Figure'>
sage: axes = figure.axes[0]
| | 3 | No.3 Revision |
You may do:
sage: p = plot(sin(x), (x, -2*pi, 2*pi))
sage: p.show(figsize=[8,1])
to change the scaling:
The method save accepts the same argument:
sage: p.save('image.png', figsize=[8,1])
To do further changes on the figure, you may get the matplotlib object behind the 2d Graphics object and use matplotlib possibilities:
sage: figure = p.matplotlib()
p.matplotlib(figsize=[8,6])
sage: figure
<Figure size 640x480 800x600 with 1 Axes>
sage: type(figure)
<class 'matplotlib.figure.Figure'>
sage: axes = figure.axes[0]
