Revision history [back]
| | 1 | initial version |

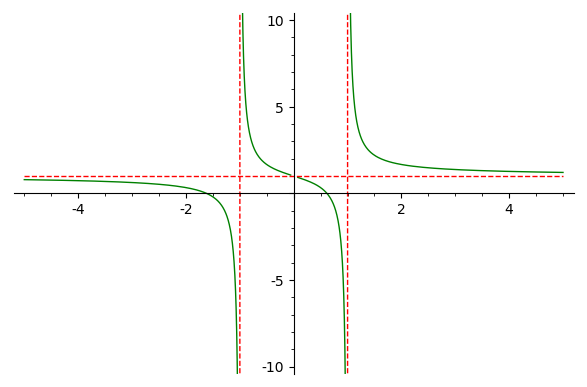
This is a follow up of @dazedANDonfused's answer to show how to plot all the asymptotes with the same style, that is, how to get the following figure:
This can be achieved with the following modification of @dazedANDonfused's code:
f = x/(x^2-1)+1
p1 = plot(f,(-5,5), detect_poles='show',color='green', ymin=-10,ymax=10)
p2 = plot(1,(-5,5), color='red', linestyle='--')

for curve in p1:
    if len(curve)==2:
        opt = curve.options()
        opt["rgbcolor"] = "red"
        curve.set_options(opt)

show(p1+p2)
Please, note that p1 contains several lines (the vertical asymptotes and four arcs of the curve $y=f(x)$), each one having its own style and number of points. It can be seen as follows:
sage: print(p1)
Graphics object consisting of 6 graphics primitives
sage: for curve in p1:
....:     print(curve)
Line defined by 233 points
Line defined by 2 points
Line defined by 162 points
Line defined by 152 points
Line defined by 2 points
Line defined by 214 points
Asymptotes are the only lines with two points. The loop added to @dazedANDonfused's code selects these lines and changes the item corresponding to color in the dictionary which contains the line options.
