Revision history [back]
| | 1 | initial version |
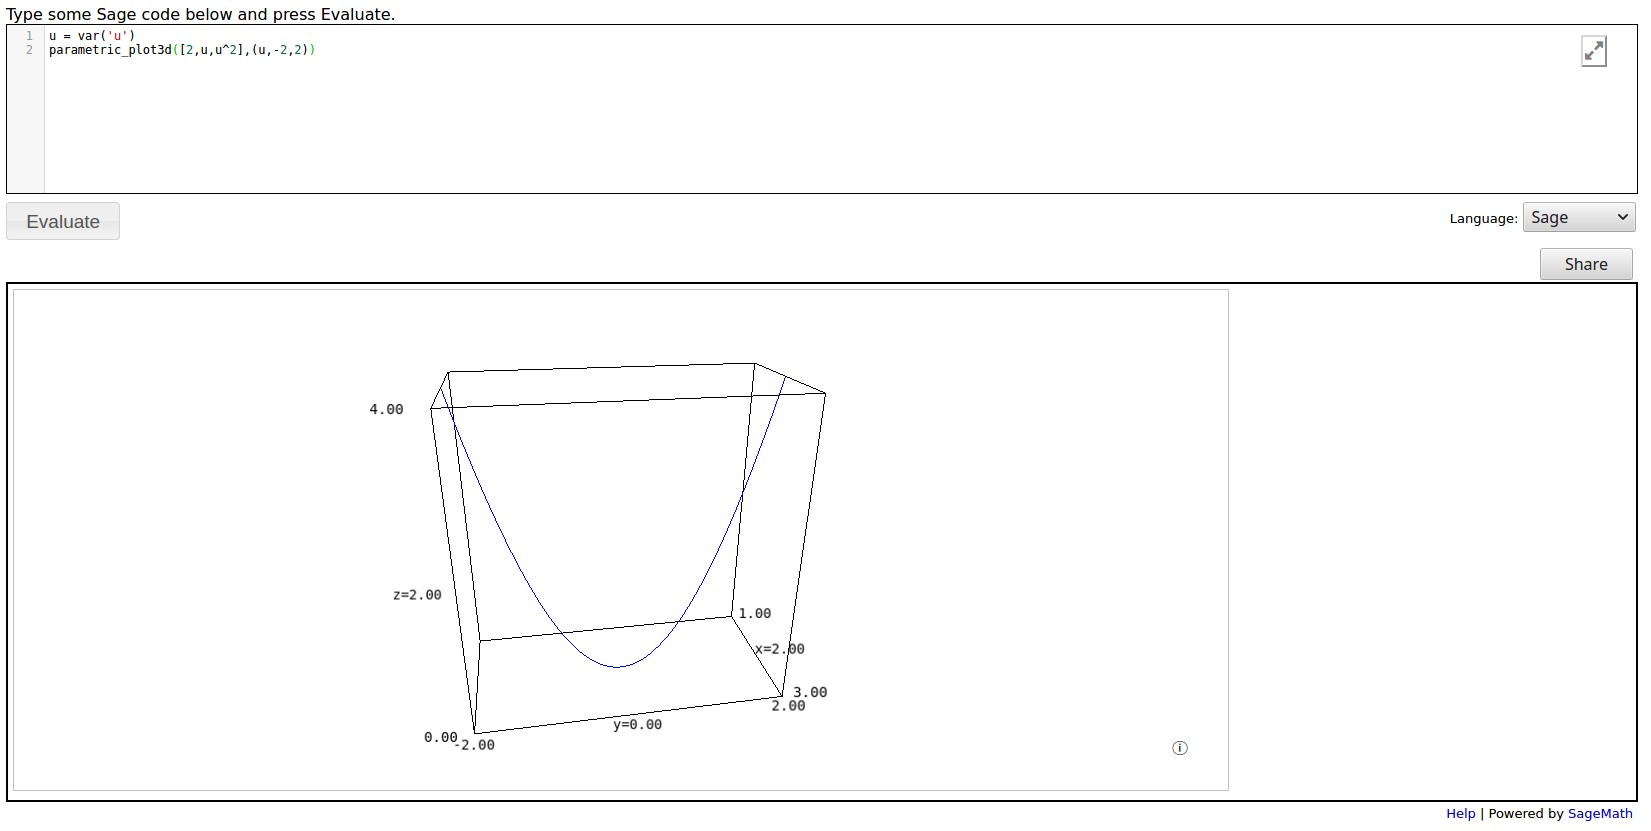
To get your plot using the parametric_plot3d command that vdelecroix suggested, you could try:
u = var('u')
parametric_plot3d([2,u,u^2],(u,-2,2))
The result, running in a SageCellServer is shown: