Revision history [back]
| | 1 | initial version |
I am a Quantitative Epidemiology PhD student brushing up on my calculus skills using a free textbook online called Multivariate analysis.
Okay, a real call for help. We tend to avoid giving pre-cooked answers to lazy undergrads' homework...
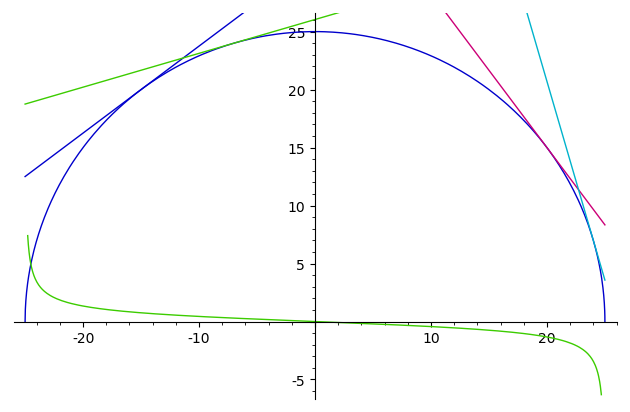
f(x)=sqrt(625-x^2)
Curves=plot([f, f.diff(x)],(-25, 25), ymin=-6, ymax=26, aspect_ratio=1)
Tangents=plot([(f(u)+(x-u)*f.diff(x)(u)) for u in [-15, -7, 20, 24]], (x, -25, 25))
Curves+Tangents
This code takes advantage of a couple not-so-obvious `Sage` features:
- `plot accepts a sequence (here, lists) as first argument.
- In the first call (to get
Curves), this is a list of (symbolic) functions; the second argument is just a range for the argument of the function(s). - In the second case, it is a list of symbolic expressions; Therefore, the second argument specifies the name of the (symbolic) variable taking values in the range it specifies.
- I didn't bother to fix the colors, the labels nor a legend; this is left as an (useful) exercise for the reader.
- I did specify a range for the ordinates in the first plot. It is also used for the superposition of the two plots.
A lot more could be said. But:
r.library("fortunes")
r.fortune("'TFM'")

This is all documented in TFM. Those who WTFM don't want to have to WTFM again
on the mailing list. RTFM.
   -- Barry Rowlingson
      R-help (October 2003)
But you're in luck. TFM is marvelously supplemented by this book, freely available, which will certainly help you (even if some details (notebook) have changed and others (Python 3) will change soon).
If you're not primarily a native English speaker, the original French version, or a German translation are also available via the same page.
| | 2 | No.2 Revision |
I am a Quantitative Epidemiology PhD student brushing up on my calculus skills using a free textbook online called Multivariate analysis.
Okay, a real call for help. We tend to avoid giving pre-cooked answers to lazy undergrads' homework...
f(x)=sqrt(625-x^2)
Curves=plot([f, f.diff(x)],(-25, 25), ymin=-6, ymax=26, aspect_ratio=1)
Tangents=plot([(f(u)+(x-u)*f.diff(x)(u)) for u in [-15, -7, 20, 24]], (x, -25, 25))
Curves+Tangents
This code takes advantage of a couple not-so-obvious `Sage` features:
- `plot accepts a sequence (here, lists) as first argument.
- In the first call (to get
Curves), this is a list of (symbolic) functions; the second argument is just a range for the argument of the function(s). - In the second case, it is a list of symbolic expressions; Therefore, the second argument specifies the name of the (symbolic) variable taking values in the range it specifies.
- I didn't bother to fix the colors, the labels nor a legend; this is left as an (useful) exercise for the reader.
- I did specify a range for the ordinates in the first plot. It is also used for the superposition of the two plots.
A lot more could be said. But:
r.library("fortunes")
r.fortune("'TFM'")

This is all documented in TFM. Those who WTFM don't want to have to WTFM again
on the mailing list. RTFM.
   -- Barry Rowlingson
      R-help (October 2003)
But you're in luck. TFM is marvelously supplemented by this book, freely available, which will certainly help you (even if some details (notebook) have changed and others (Python 3) will change soon).
If you're not primarily a native English speaker, the original French version, or a German translation are also available via the same page.
