Revision history [back]
| | 1 | initial version |

Please, try the following code:
import csv
with open('test.csv') as csv_file:
data = list(csv.reader(csv_file))
ndata = len(data)
data = map(lambda x: [float(x[0]),float(x[1])], data)
data = matrix(data)
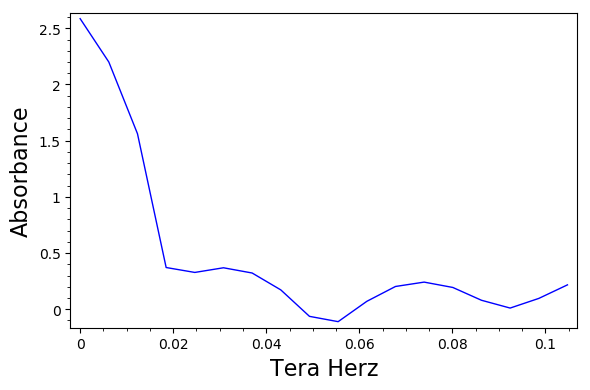
P = list_plot(data, plotjoined=True, color='blue',
frame=True, axes=False, axes_labels=["Tera Herz", "Absorbance"])
P.show()
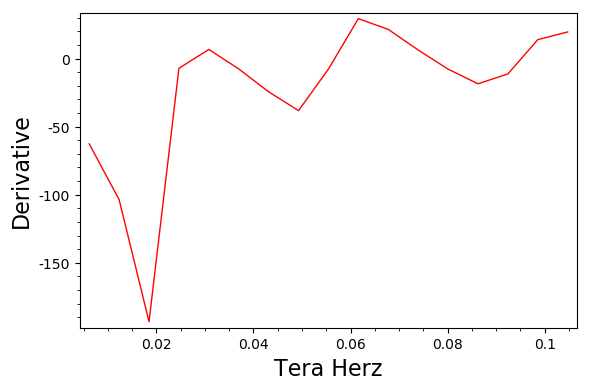
t = [(data[i+1,1]-data[i,1])/(data[i+1,0]-data[i,0]) for i in range(ndata-1)]
l = list_plot(matrix([data[1:,0].list(),t]).transpose(), plotjoined=True, color='red',
frame=True, axes=False, axes_labels=["Tera Herz", "Derivative"])
l.show()
Here, test.csv is a file with the data you provided. As an alternative, with a more clear code but perhaps slower:
import csv
with open('test.csv') as csv_file:
    data = csv.reader(csv_file)
    xx, yy = [], []
    for row in data:
        xx.append(float(row[0]))
        yy.append(float(row[1]))
ndata = len(xx)
P = list_plot(matrix([xx,yy]).transpose(), plotjoined=True, color='blue',
              frame=True, axes=False, axes_labels=["Tera Herz", "Absorbance"])
P.show()
t = [(yy[i+1]-yy[i])/(xx[i+1]-xx[i]) for i in range(ndata-1)]
l = list_plot(matrix([xx[1:],t]).transpose(), plotjoined=True, color='red',
              frame=True, axes=False, axes_labels=["Tera Herz", "Derivative"])
l.show()
In both cases I get the following pictures:
| | 2 | No.2 Revision |
Please, try the following code:
import csv
with open('test.csv') open("test.csv") as csv_file:
    data = list(csv.reader(csv_file))
ndata = len(data)
data = map(lambda x: [float(x[0]),float(x[1])], data)
data = matrix(data)
P = list_plot(data, plotjoined=True, color='blue',
color="blue",
              frame=True, axes=False, axes_labels=["Tera Herz", "Absorbance"])
P.show()
t = [(data[i+1,1]-data[i,1])/(data[i+1,0]-data[i,0]) for i in range(ndata-1)]
l = list_plot(matrix([data[1:,0].list(),t]).transpose(), plotjoined=True, color='red',
color="red",
              frame=True, axes=False, axes_labels=["Tera Herz", "Derivative"])
l.show()
Here, test.csv is a file with the data you provided. As an alternative, with a more clear code but perhaps slower:
import csv
with open('test.csv') open("test.csv") as csv_file:
    data = csv.reader(csv_file)
    xx, yy = [], []
    for row in data:
        xx.append(float(row[0]))
        yy.append(float(row[1]))
ndata = len(xx)
P = list_plot(matrix([xx,yy]).transpose(), plotjoined=True, color='blue',
color="blue",
              frame=True, axes=False, axes_labels=["Tera Herz", "Absorbance"])
P.show()
t = [(yy[i+1]-yy[i])/(xx[i+1]-xx[i]) for i in range(ndata-1)]
l = list_plot(matrix([xx[1:],t]).transpose(), plotjoined=True, color='red',
color="red",
              frame=True, axes=False, axes_labels=["Tera Herz", "Derivative"])
l.show()
In both cases I get the following pictures:
| | 3 | No.3 Revision |
Please, try the following code:
import csv
with open("test.csv") as csv_file:
    data = list(csv.reader(csv_file))
ndata = len(data)
data = map(lambda x: [float(x[0]),float(x[1])], data)
data = matrix(data)
P = list_plot(data, plotjoined=True, color="blue",
              frame=True, axes=False, axes_labels=["Tera Herz", "Absorbance"])
P.show()
t = [(data[i+1,1]-data[i,1])/(data[i+1,0]-data[i,0]) for i in range(ndata-1)]
l = list_plot(matrix([data[1:,0].list(),t]).transpose(), plotjoined=True, color="red",
list_plot(zip(data[1:,0].list(),t), plotjoined=True, color='red',
              frame=True, axes=False, axes_labels=["Tera Herz", "Derivative"])
l.show()
Here, test.csv is a file with the data you provided. As an alternative, with a more clear code but perhaps slower:
import csv
with open("test.csv") as csv_file:
    data = csv.reader(csv_file)
    xx, yy = [], []
    for row in data:
        xx.append(float(row[0]))
        yy.append(float(row[1]))
ndata = len(xx)
P = list_plot(matrix([xx,yy]).transpose(), list_plot(zip(xx,yy), plotjoined=True, color="blue",
              frame=True, axes=False, axes_labels=["Tera Herz", "Absorbance"])
P.show()
t = [(yy[i+1]-yy[i])/(xx[i+1]-xx[i]) for i in range(ndata-1)]
l = list_plot(matrix([xx[1:],t]).transpose(), list_plot(zip(xx[1:],t), plotjoined=True, color="red",
              frame=True, axes=False, axes_labels=["Tera Herz", "Derivative"])
l.show()
In both cases I get the following pictures:
| | 4 | No.4 Revision |
Please, try the following code:
import csv
with open("test.csv") as csv_file:
    data = list(csv.reader(csv_file))
ndata = len(data)
data = map(lambda x: [float(x[0]),float(x[1])], data)
data = matrix(data)
P = list_plot(data, plotjoined=True, color="blue",
              frame=True, axes=False, axes_labels=["Tera Herz", "Absorbance"])
P.show()
t = [(data[i+1,1]-data[i,1])/(data[i+1,0]-data[i,0]) for i in range(ndata-1)]
l = list_plot(zip(data[1:,0].list(),t), plotjoined=True, color='red',
              frame=True, axes=False, axes_labels=["Tera Herz", "Derivative"])
l.show()
Here, test.csv is a file with the data you provided. As an alternative, with a more clear code but perhaps slower:
import csv
with open("test.csv") as csv_file:
    data = csv.reader(csv_file)
    xx, yy = [], []
    for row in data:
        xx.append(float(row[0]))
        yy.append(float(row[1]))
ndata = len(xx)
P = list_plot(zip(xx,yy), plotjoined=True, color="blue",
              frame=True, axes=False, axes_labels=["Tera Herz", "Absorbance"])
P.show()
t = [(yy[i+1]-yy[i])/(xx[i+1]-xx[i]) for i in range(ndata-1)]
l = list_plot(zip(xx[1:],t), plotjoined=True, color="red",
              frame=True, axes=False, axes_labels=["Tera Herz", "Derivative"])
l.show()
Edited. Following the advice of @Iguananaut, let us use Numpy. The code becomes:
import numpy as np
data = np.loadtxt("test.csv", delimiter=",")
P = list_plot(data, plotjoined=True, color="blue",
              frame=True, axes=False, axes_labels=["Tera Herz", "Absorbance"])
P.show()
t = np.diff(data[:,1])/np.diff(data[:,0])
l = list_plot(zip(data[1:,0],t), plotjoined=True, color='red',
              frame=True, axes=False, axes_labels=["Tera Herz", "Derivative"])
l.show()
In both cases any case I get the following pictures:
