Revision history [back]
| | 1 | initial version |
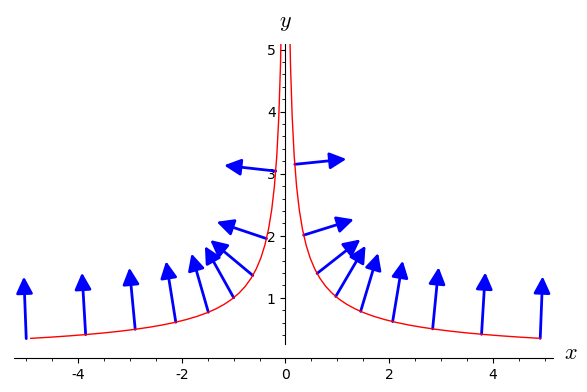
A solution is to transform the implicit graph into a curve and to use the method along of vector fields:
E.<x,y> = EuclideanSpace()
f(x,y) = 2*x*y^3
g(x,y) = x^2*3*y^2
v = E.vector_field([f(x,y)/sqrt(f(x,y)^2+g(x,y)^2),
                    g(x,y)/sqrt(f(x,y)^2+g(x,y)^2)])
t = var('t')
S = E.curve([t^3, t^(-2)], t)
vS = v.along(S)
graph = S.plot(prange=(-1.7, 1.7))
graph += vS.plot(E.cartesian_coordinates(), ranges={t: (-1.71, 1.7)},
                 number_values=25)
show(graph, ymax=5)
| | 2 | No.2 Revision |
A solution is to transform the implicit graph into a curve and to use the method along of vector fields:
E.<x,y> = EuclideanSpace()
f(x,y) = 2*x*y^3
g(x,y) = x^2*3*y^2
v = E.vector_field([f(x,y)/sqrt(f(x,y)^2+g(x,y)^2),
                    g(x,y)/sqrt(f(x,y)^2+g(x,y)^2)])
t = var('t')
S = E.curve([t^3, t^(-2)], t)
vS = v.along(S)
graph = S.plot(prange=(-1.7, 1.7))
graph += vS.plot(E.cartesian_coordinates(), ranges={t: (-1.71, 1.7)},
                 number_values=25)
show(graph, ymax=5)
See this page for help/tutorials on vector fields with Sage.
