Revision history [back]
| | 1 | initial version |
I do not see any difference, except that wolfram cut part of the graph where your function takes higer values.
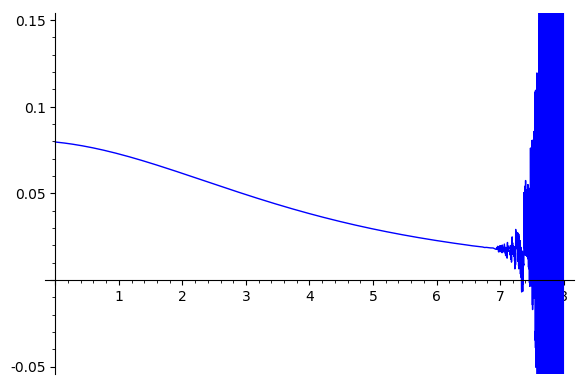
You can change the range of y-values to be between -0.05 and 0.15: just replace the last line of the Sage code by:
plot(V(a,1),a,0,8,ymax=0.15,ymin=-0.05)
You will get: