Revision history [back]
| | 1 | initial version |
You may use text to create a text 2D graphics object and + to join the graphics:
sage: f(x)=x/33.82
sage: plotEquation = plot(f(x),-1,70)
sage: equationDifferential = f.diff()(x)
sage: big_image = plotEquation
sage: equationDifferential
0.0295683027794205
sage: t = text("slope = {}".format(equationDifferential), (.5, 1), axis_coords=True)
sage: s = text("example", (60, 1), color='orange')
sage: big_image = plotEquation + t + s
sage: big_image
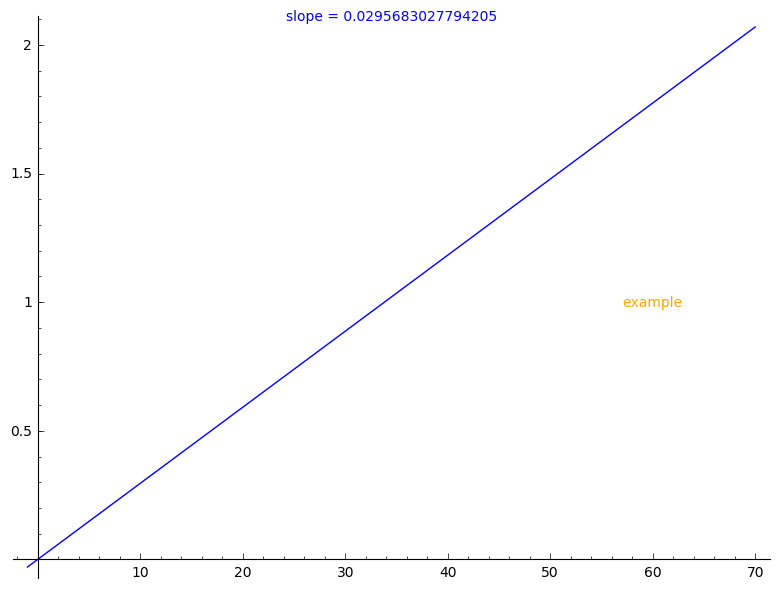
Note that axis_coords=True changes the coordinate system as described by the documentation of text:
   * "axis_coords" - (default: False) If True, use axis coordinates,
     so that (0,0) is the lower left and (1,1) upper right, regardless
     of the x and y range of plotted values.
