Revision history [back]
| | 1 | initial version |
After installing dot2tex and with graphviz installed with
sage -i dot2tex
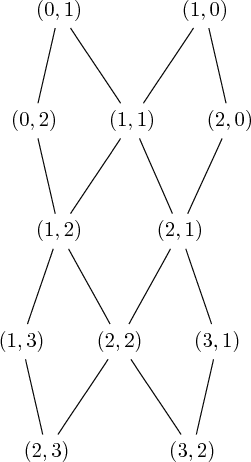
you may create a tikzpicture from the positions of vertices decided by graphviz:
sage: G = graphs.AztecDiamondGraph(2)
sage: G.latex_options().set_options(format='dot2tex', prog='dot', edge_labels=True, color_by_label=False)
The tikzpicture code is:
sage: latex(G)
\begin{tikzpicture}[>=latex,line join=bevel,]
%%
\node (node_9) at (26.5bp,8.5bp) [draw,draw=none] {$\left(2, 3\right)$};
  \node (node_8) at (61.5bp,61.5bp) [draw,draw=none] {$\left(2, 2\right)$};
  \node (node_7) at (90.5bp,114.5bp) [draw,draw=none] {$\left(2, 1\right)$};
  \node (node_6) at (114.5bp,167.5bp) [draw,draw=none] {$\left(2, 0\right)$};
  \node (node_5) at (14.5bp,61.5bp) [draw,draw=none] {$\left(1, 3\right)$};
  \node (node_4) at (32.5bp,114.5bp) [draw,draw=none] {$\left(1, 2\right)$};
  \node (node_3) at (67.5bp,167.5bp) [draw,draw=none] {$\left(1, 1\right)$};
  \node (node_2) at (102.5bp,220.5bp) [draw,draw=none] {$\left(1, 0\right)$};
  \node (node_1) at (20.5bp,167.5bp) [draw,draw=none] {$\left(0, 2\right)$};
  \node (node_0) at (32.5bp,220.5bp) [draw,draw=none] {$\left(0, 1\right)$};
  \node (node_11) at (96.5bp,8.5bp) [draw,draw=none] {$\left(3, 2\right)$};
  \node (node_10) at (108.5bp,61.5bp) [draw,draw=none] {$\left(3, 1\right)$};
  \draw [black,] (node_0) ..controls (44.282bp,202.33bp) and (55.687bp,185.71bp)  .. (node_3);
  \draw [black,] (node_4) ..controls (42.262bp,96.332bp) and (51.712bp,79.713bp)  .. (node_8);
  \draw [black,] (node_4) ..controls (26.441bp,96.332bp) and (20.575bp,79.713bp)  .. (node_5);
  \draw [black,] (node_8) ..controls (49.718bp,43.332bp) and (38.313bp,26.713bp)  .. (node_9);
  \draw [black,] (node_3) ..controls (55.718bp,149.33bp) and (44.313bp,132.71bp)  .. (node_4);
  \draw [black,] (node_6) ..controls (106.42bp,149.33bp) and (98.6bp,132.71bp)  .. (node_7);
  \draw [black,] (node_5) ..controls (18.539bp,43.332bp) and (22.45bp,26.713bp)  .. (node_9);
  \draw [black,] (node_8) ..controls (73.282bp,43.332bp) and (84.687bp,26.713bp)  .. (node_11);
  \draw [black,] (node_1) ..controls (24.539bp,149.33bp) and (28.45bp,132.71bp)  .. (node_4);
  \draw [black,] (node_2) ..controls (90.718bp,202.33bp) and (79.313bp,185.71bp)  .. (node_3);
  \draw [black,] (node_7) ..controls (80.738bp,96.332bp) and (71.288bp,79.713bp)  .. (node_8);
  \draw [black,] (node_2) ..controls (106.54bp,202.33bp) and (110.45bp,185.71bp)  .. (node_6);
  \draw [black,] (node_0) ..controls (28.461bp,202.33bp) and (24.55bp,185.71bp)  .. (node_1);
  \draw [black,] (node_10) ..controls (104.46bp,43.332bp) and (100.55bp,26.713bp)  .. (node_11);
  \draw [black,] (node_7) ..controls (96.559bp,96.332bp) and (102.42bp,79.713bp)  .. (node_10);
  \draw [black,] (node_3) ..controls (75.242bp,149.33bp) and (82.737bp,132.71bp)  .. (node_7);
%
\end{tikzpicture}
You may get a preview:
sage: view(G)
| | 2 | No.2 Revision |
After installing dot2tex and with graphviz installed with
sage -i dot2tex
and with graphviz installed, you may create a tikzpicture from the positions of vertices decided by graphviz:
sage: G = graphs.AztecDiamondGraph(2)
sage: G.latex_options().set_options(format='dot2tex', prog='dot', edge_labels=True, color_by_label=False)
The tikzpicture code is:
sage: latex(G)
\begin{tikzpicture}[>=latex,line join=bevel,]
%%
\node (node_9) at (26.5bp,8.5bp) [draw,draw=none] {$\left(2, 3\right)$};
  \node (node_8) at (61.5bp,61.5bp) [draw,draw=none] {$\left(2, 2\right)$};
  \node (node_7) at (90.5bp,114.5bp) [draw,draw=none] {$\left(2, 1\right)$};
  \node (node_6) at (114.5bp,167.5bp) [draw,draw=none] {$\left(2, 0\right)$};
  \node (node_5) at (14.5bp,61.5bp) [draw,draw=none] {$\left(1, 3\right)$};
  \node (node_4) at (32.5bp,114.5bp) [draw,draw=none] {$\left(1, 2\right)$};
  \node (node_3) at (67.5bp,167.5bp) [draw,draw=none] {$\left(1, 1\right)$};
  \node (node_2) at (102.5bp,220.5bp) [draw,draw=none] {$\left(1, 0\right)$};
  \node (node_1) at (20.5bp,167.5bp) [draw,draw=none] {$\left(0, 2\right)$};
  \node (node_0) at (32.5bp,220.5bp) [draw,draw=none] {$\left(0, 1\right)$};
  \node (node_11) at (96.5bp,8.5bp) [draw,draw=none] {$\left(3, 2\right)$};
  \node (node_10) at (108.5bp,61.5bp) [draw,draw=none] {$\left(3, 1\right)$};
  \draw [black,] (node_0) ..controls (44.282bp,202.33bp) and (55.687bp,185.71bp)  .. (node_3);
  \draw [black,] (node_4) ..controls (42.262bp,96.332bp) and (51.712bp,79.713bp)  .. (node_8);
  \draw [black,] (node_4) ..controls (26.441bp,96.332bp) and (20.575bp,79.713bp)  .. (node_5);
  \draw [black,] (node_8) ..controls (49.718bp,43.332bp) and (38.313bp,26.713bp)  .. (node_9);
  \draw [black,] (node_3) ..controls (55.718bp,149.33bp) and (44.313bp,132.71bp)  .. (node_4);
  \draw [black,] (node_6) ..controls (106.42bp,149.33bp) and (98.6bp,132.71bp)  .. (node_7);
  \draw [black,] (node_5) ..controls (18.539bp,43.332bp) and (22.45bp,26.713bp)  .. (node_9);
  \draw [black,] (node_8) ..controls (73.282bp,43.332bp) and (84.687bp,26.713bp)  .. (node_11);
  \draw [black,] (node_1) ..controls (24.539bp,149.33bp) and (28.45bp,132.71bp)  .. (node_4);
  \draw [black,] (node_2) ..controls (90.718bp,202.33bp) and (79.313bp,185.71bp)  .. (node_3);
  \draw [black,] (node_7) ..controls (80.738bp,96.332bp) and (71.288bp,79.713bp)  .. (node_8);
  \draw [black,] (node_2) ..controls (106.54bp,202.33bp) and (110.45bp,185.71bp)  .. (node_6);
  \draw [black,] (node_0) ..controls (28.461bp,202.33bp) and (24.55bp,185.71bp)  .. (node_1);
  \draw [black,] (node_10) ..controls (104.46bp,43.332bp) and (100.55bp,26.713bp)  .. (node_11);
  \draw [black,] (node_7) ..controls (96.559bp,96.332bp) and (102.42bp,79.713bp)  .. (node_10);
  \draw [black,] (node_3) ..controls (75.242bp,149.33bp) and (82.737bp,132.71bp)  .. (node_7);
%
\end{tikzpicture}
You may get a preview:
sage: view(G)
