Revision history [back]
| | 1 | initial version |
If you plot your function first, for example with
f = diff(zeta(x))/zeta(x)+.75
plot(f,0,10,ymin=-5,ymax=5,detect_poles=True,figsize=[4,3])
you can see approximately where the zero is:
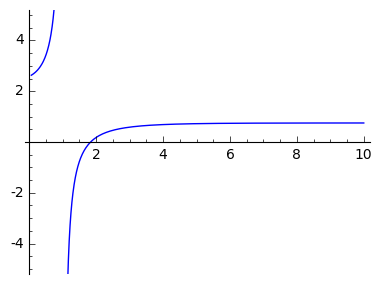
You just need to change the range over which you're searching:
find_root(f,0,10)
1.8333259941894324
Here's a link to live example.
