Revision history [back]
| | 1 | initial version |

Hope you are enjoying Sage so far.
A good place to check for things is the sage documentation.
For example, here are some examples which might be relevant for you. The following modification might give you a hint about how to proceed.
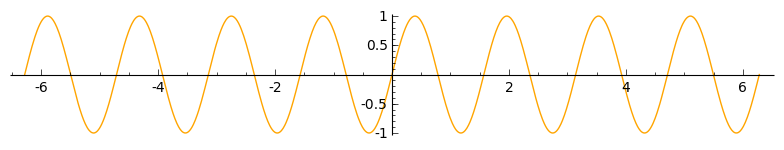
h(x) = sin(4*x)
plot(h,(-2*pi,2*pi),color='orange')
Output:
Here is another reference which might be useful.
