Hello!
Could you pleas advise me the best way to plot graph with cycles and make it looks like tree? Here is the sample picture of result I'd like to have:
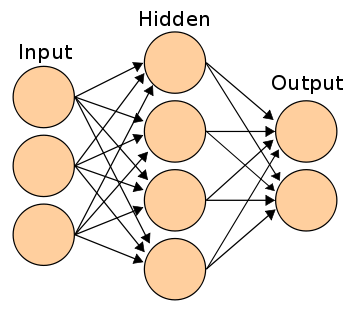
Plot on this pictures have 'layers', is there any chance to get something like this in Sage? I tried this:
t = DiGraph()
t.add_edge((0,1))
t.add_edge((0,2))
t.add_edge((0,3))
t.add_edge((0,4))

t.add_edge((4,9))
t.add_edge((3,9))
t.add_edge((2,9))
t.add_edge((1,9))

t.plot()
but the result is far from desired.
Thanks.
