How to adjust the size of graphs in `graphs_list.show_graphs`
The following code is used to find some cospectral graphs. I want to show it in pairs with a for-loop. But each line of the graphs looks too small and there is too much space between each pair of graphs. I want to show them in a beautiful way.
g=graphs.cospectral_graphs(6)
l=len(g)
for i in range(l):
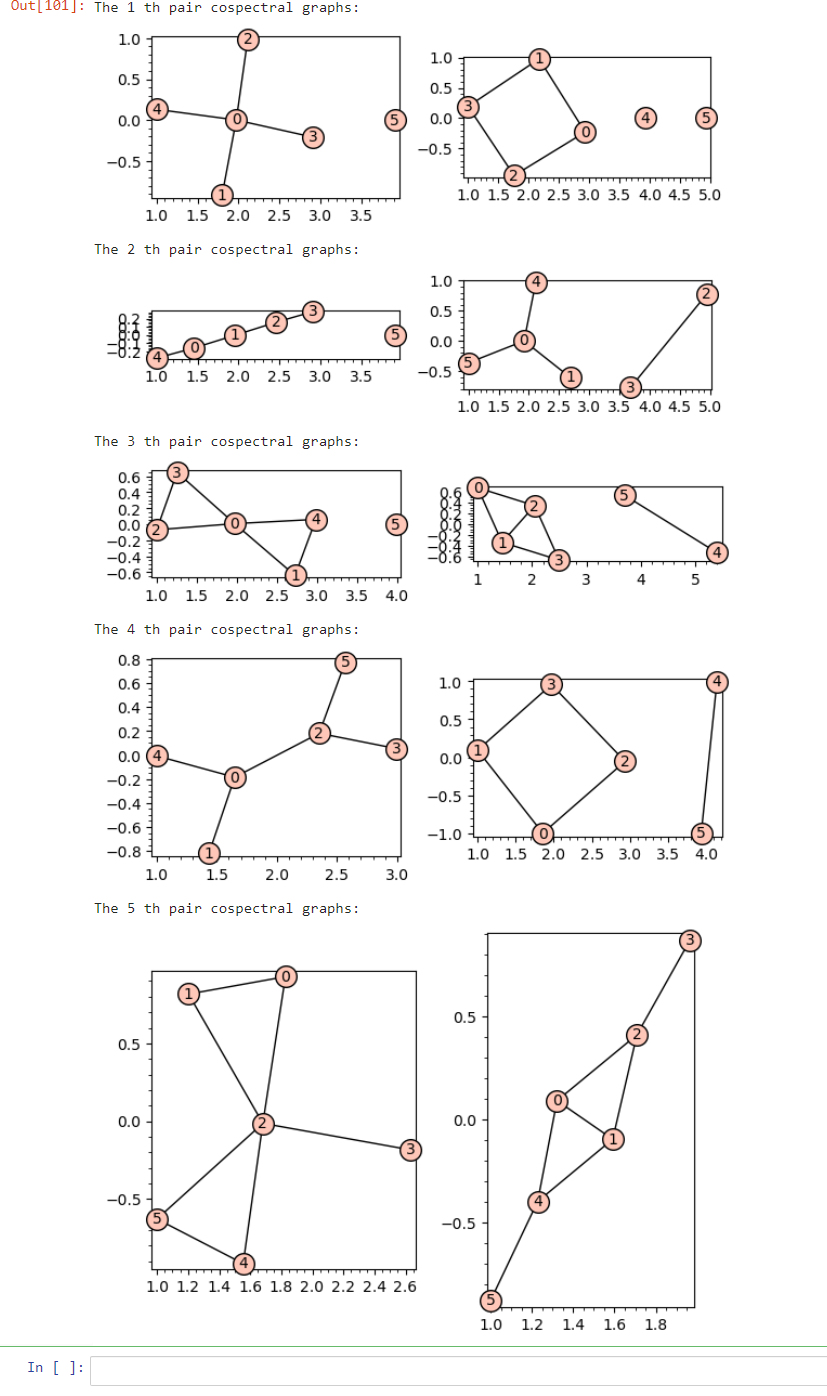
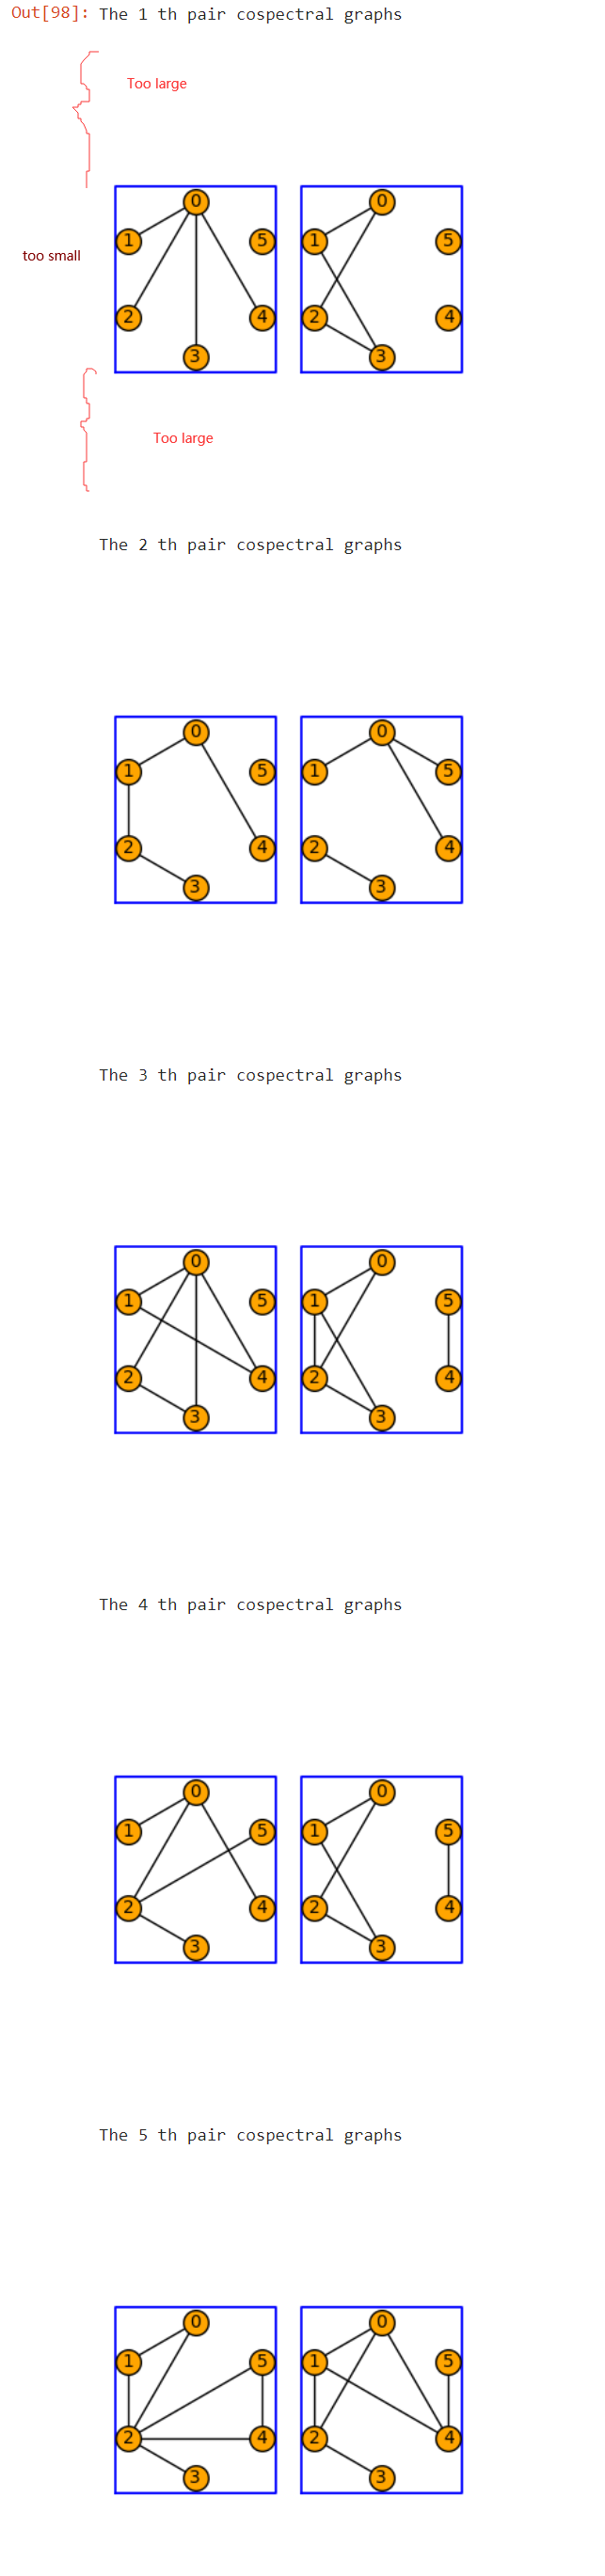
print("The",i+1, "th pair cospectral graphs")
graphs_list.show_graphs(g[i],vertex_size=200,figsize=100,vertex_labels=True,vertex_color='orange')
I tried another method, but I won't method. I put a border for each frame around the graph yet (like the blue border above). The border for each graph in the following picture is ugly. not is inconsistent. (The reason for putting a border on each graph is to better distinguish the different graphs)
g=graphs.cospectral_graphs(6)
l=len(g)
for i in range(l):
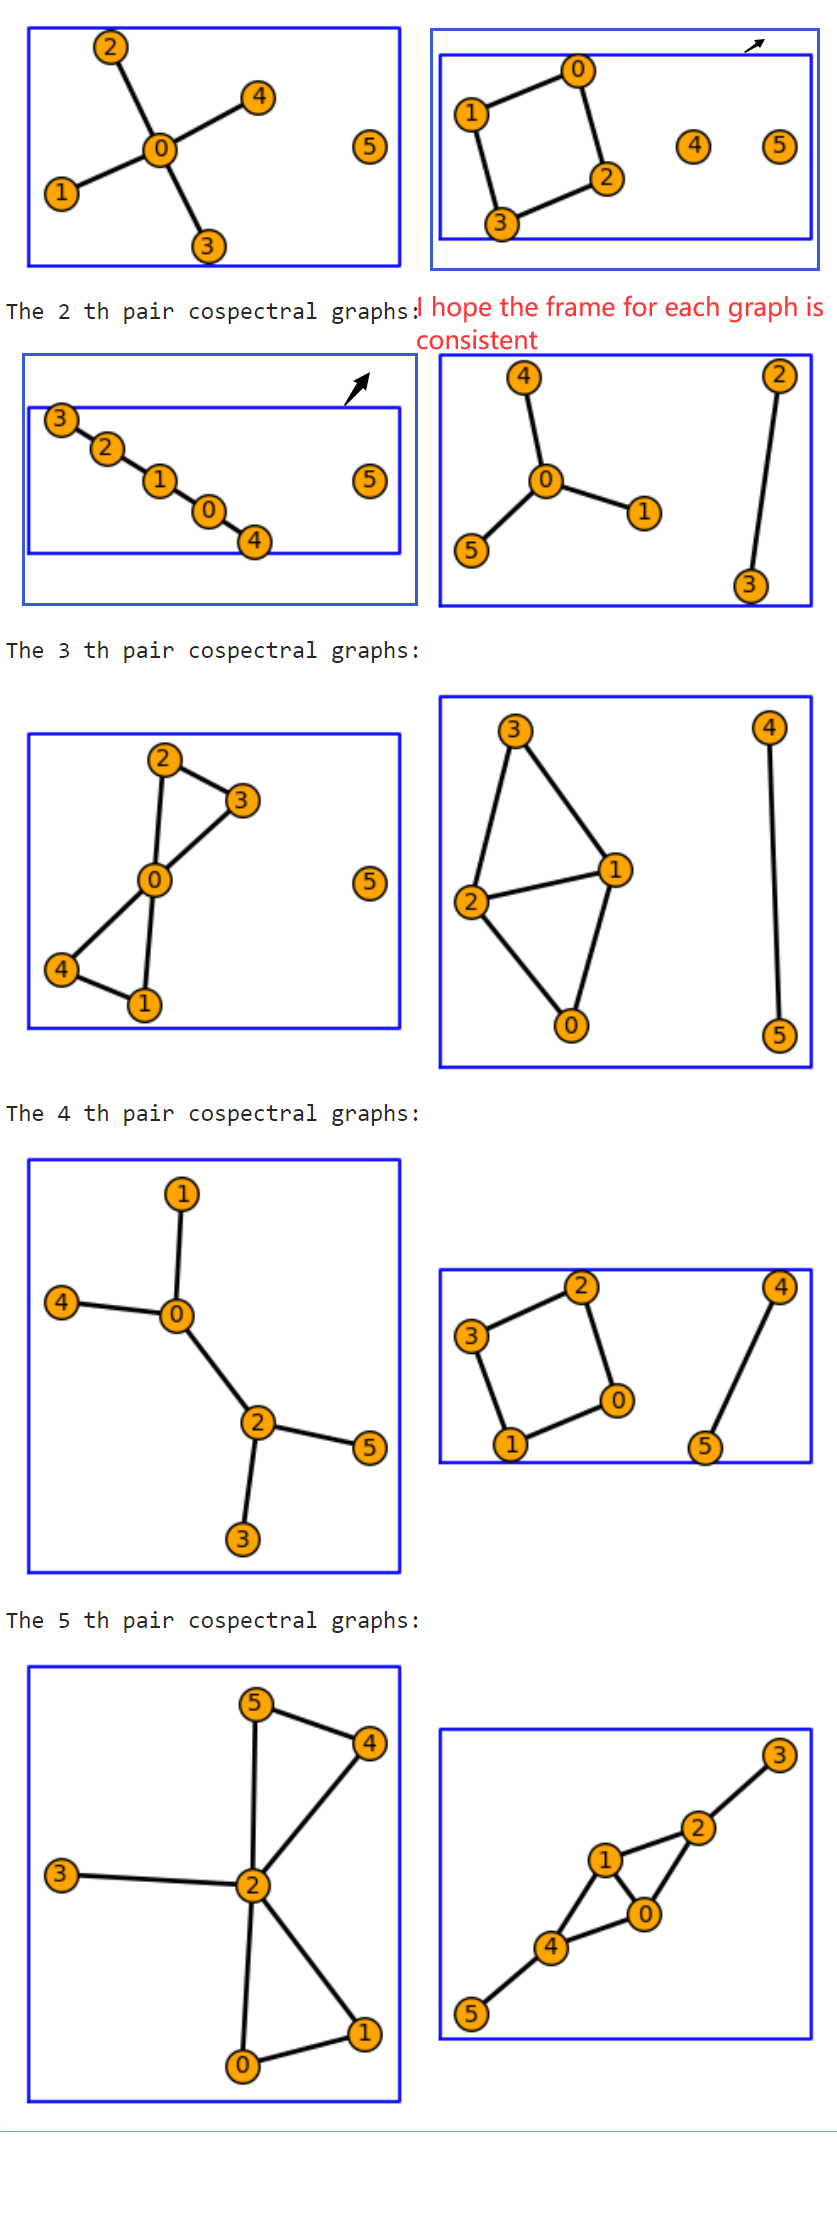
G=[plot(g[i][j]) G=[plot(g[i][j],graph_border=True,edge_thickness=2, vertex_size=200,vertex_labels=True,vertex_color='orange') for j in range(len(g[i]))]
print("The",i+1, "th pair cospectral graphs:")
graphics_array(G).show(frame=True, axes=False)
graphics_array(G).show(figsize=5)