I have a simple plot with a legend in different colors. The result will be correct or incorrect depending of the order of the graphic elements.
This code gives an incorrect result:
reset()
Plaut = Graphics()
Plaut+=point([1,1/2],color='blue',size=15,legend_label='Sample point', legend_color='blue')
Plaut+=plot(x/2,x,0,2,color='black', thickness=0.2,legend_label='black line', legend_color='black')
Plaut+=plot(-x/2+1,x,0,2,color='red', thickness=0.2,legend_label='red line', legend_color='red')
Plaut.set_legend_options(loc=(1.1,0), markerscale=1)
show(Plaut, title='Color of the marker - 1.')
see 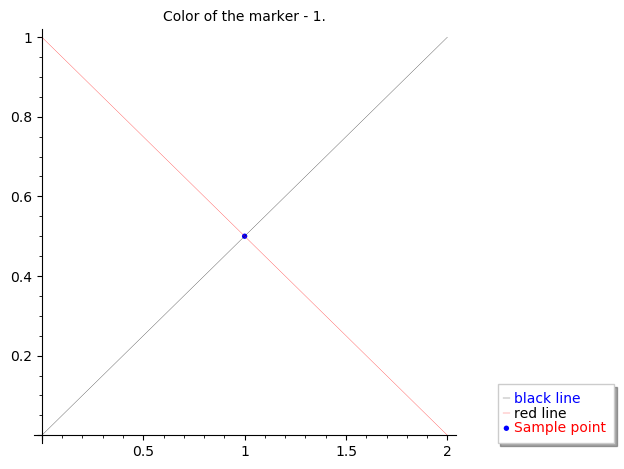
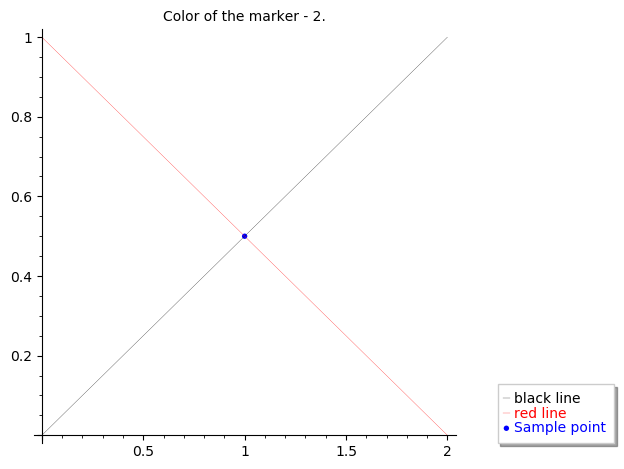
while this one (the only difference with the first one being the order of the graphic elements) gives a correct result:
reset()
Plaut = Graphics()
Plaut+=plot(x/2,x,0,2,color='black', thickness=0.2,legend_label='black line', legend_color='black')
Plaut+=plot(-x/2+1,x,0,2,color='red', thickness=0.2,legend_label='red line', legend_color='red')
Plaut+=point([1,1/2],color='blue',size=15,legend_label='Sample point', legend_color='blue')
Plaut.set_legend_options(loc=(1.1,0), markerscale=1)
show(Plaut, title='Color of the marker - 2.')
Here, the result is as expected:
For this MWE the correction was easy but when I have a lot of elements it is time consuming and somewhat frustrating to manually find the right configuration. I did not find in the manual a rule to follow to directly get the correct result.
