I plot an integral with quad() function in a Python file. I wanted to plot the same result with SageMath but the values returned are differents and I really don't understand why the two graphics are not the same ... Here is my sage code :
import scipy.integrate as sp_int
int1(a, j, k,L) = piecewise([[[0,1/4],1* cos(pi * (j + 1) * a/L) * cos(pi * (k + 1) * a/L)],[(1/4,3/4),2* cos(pi * (j + 1) * a/L) * cos(pi * (k + 1) * a/L)],[[3/4,1],1* cos(pi * (j + 1) * a/L) * cos(pi * (k + 1) * a/L)]])
def int2(a, j, k,L):
if a < 1 / 4 or a > 3 / 4:
return cos(pi * (j + 1) * a/L) * cos(pi * (k + 1) * a/L)
else:
return 2* cos(pi * (j + 1) * a/L) * cos(pi * (k + 1) * a/L)
def integral1(j):
k=2
L = 0.5
return numerical_integral(int1, 0, 1,max_points=10, params=[j, k,L])[0]
def integral2(j):
k=2
L = 0.5
return sp_int.quad(int2, 0, 1, args=(j, k,L))[0]
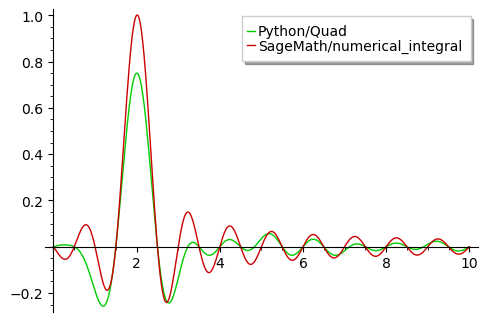
i1 = plot(integral1, 0,10,rgbcolor=(0.8,0,0),legend_label='SageMath/numerical_integral')
i2 = plot(integral2, 0,10,rgbcolor=(0,0.8,0),legend_label='Python/Quad')
show(i2+i1)
I can't upload the png to show you the result because I'm a newby with less than 60 points :-) but you can just copy this code and run it in Sage to have a look by yourself. Thanks for any help.