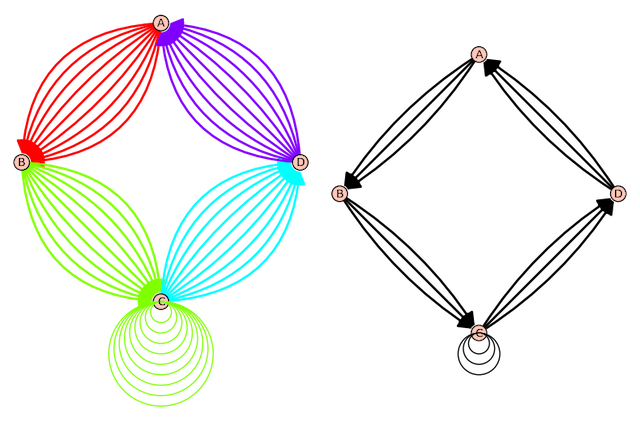
I bumped into this unusual behavior and am not sure how to fix it. When I add "color_by_label" for plotting a digraph I get the correct number SQUARED of lines appearing in the digraph. Is this an error in SageMath or is there a workaround? All monochrome lines do not work for my application.
This is my code sample
stnc = 'ABCCCCDABCDABCDA' g = DiGraph({}, loops=True, multiedges=True) for a,b in [(stnc[i], stnc[i + 1]) for i in range(len(stnc) - 1)]: g.add_edge(a, b, b)
g.plot(edge_style='solid', layout='circular', edge_labels=True, vertex_color='red').show(figsize=(8,8))
lines squared
g.plot(color_by_label=True, edge_style='solid', layout='circular').show(figsize=(8,8))
works but monchrome
g.plot(layout='circular').show(figsize=(8,8))