- How draw 2 or more functions on one image to compare?
- On AxisY (if y is small) I see 1,2,3 but I don't know if 1 means 1e-6, 1e-8 or 1e-10. Is possible draw this information on image?
- For very small y , is order of magnitude 1e-16, are visible rounding errors. Is possible draw with more precision than double? I see "fast_callable" example but this not works in my case.
Revision history [back]
| | 1 | initial version |
Some 2-d plot questions
| | 2 | None |
Some 2-d plot questions
- How draw 2 or more functions on one image to compare?
- On AxisY (if y is small) I see 1,2,3 but I don't know if 1 means 1e-6, 1e-8 or 1e-10. Is possible draw this information on image?
- For very small y , is order of magnitude 1e-16, are visible rounding errors. Is possible draw with more precision than double? I see "fast_callable" example but this not works in my case.
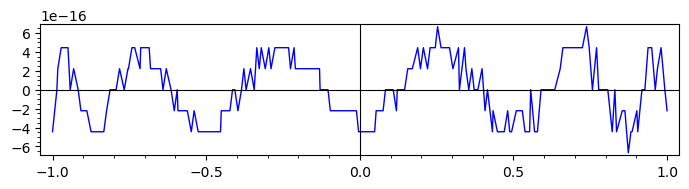
Example for question 3.
Goal: plot p(x)-exp(x) where p is a Chebyshev approximation of exp of degree > 10.
For a concrete example, let us use the degree 11 Chebyshev approximation for the exponential.
We rescale the x-axis from [-1,1] to [0,1],
and thus change exp(x) to exp(x/2 + 1/2).
We use this Chebyshev approximation.
f(x) = (1.648721270700127734695199 + 0.8243606353500639704213267*x + 0.2060901588375456897278408*x^2 + 0.03434835980625555348009372*x^3 + 0.004293544975435477755738488*x^4 + 0.0004293544975550920330337524*x^5 + 3.577954294118110098524956e-05*x^6 + 2.555681612268918733452545e-06*x^7 + 1.597272498430465439987321e-07*x^8 + 8.873762489265668731711247e-09*x^9 + 4.462222789173961848447732e-10*x^10 + 2.027323563290198480646098e-11*x^11)Here is the plot we get:
plot(f(x) - exp(x/2 + 1/2), x)or, after applying some of the hints regarding question 2:
plot(f(x) - exp(x/2 + 1/2), x, frame=True, figsize=(7, 2))