Ask Your Question
0

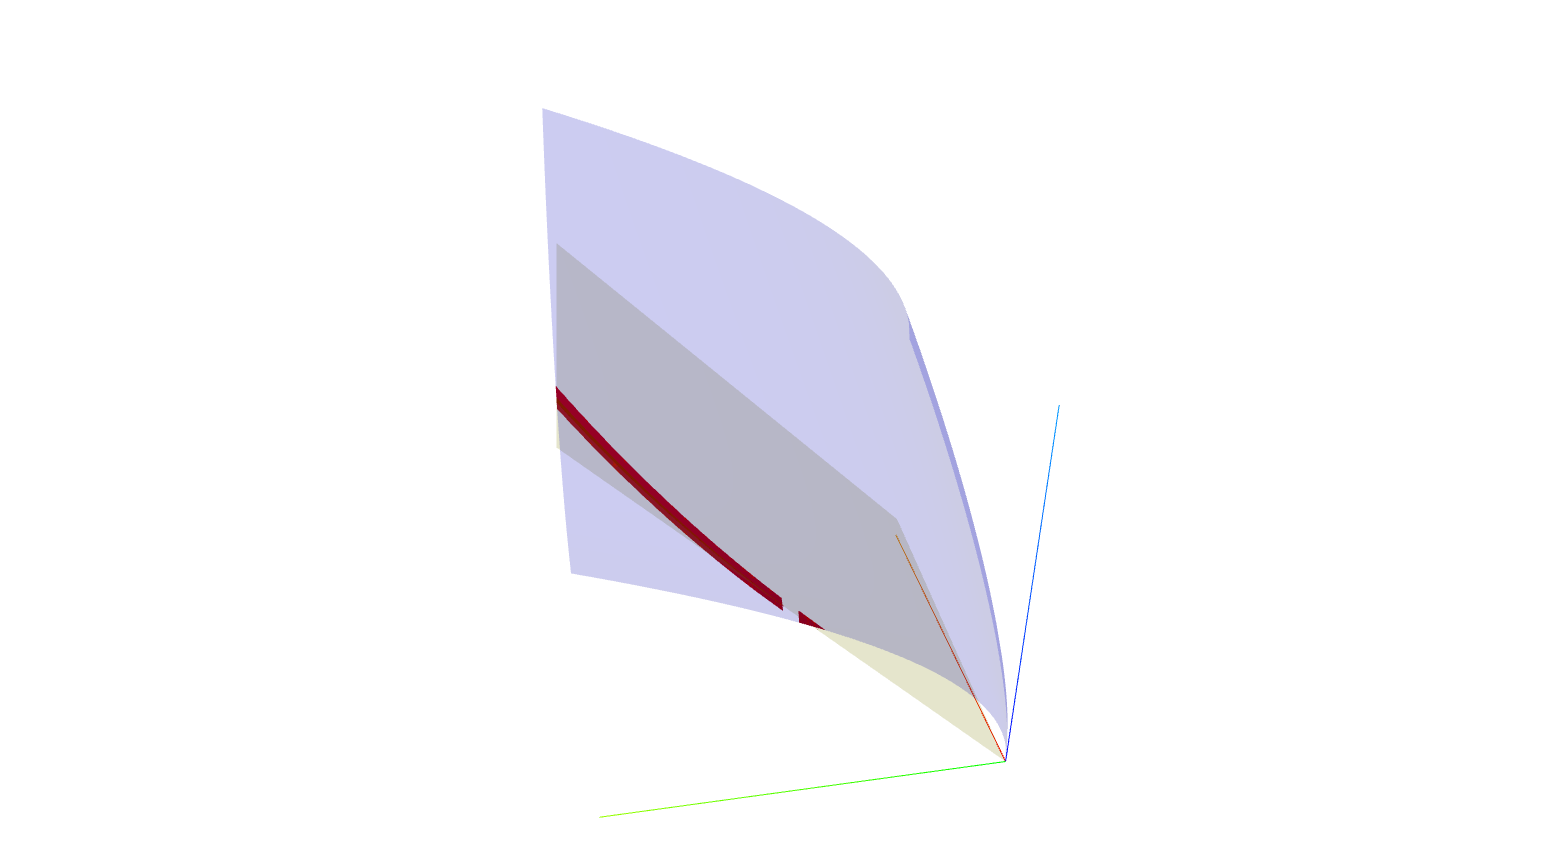
Plot the intersection of two surfaces

asked 2023-04-26 13:08:40 +0200

Cyrille gravatar image

This is a nice 3D plot

var('x,y,z')
U(x,y)=x^(1/2)*y^(1/2)
B(x,y)= (1/16)*x + y
#levels=[0.25,.5,0.75,1,1.25,1.5,1.75,2]
epsilon=0.01
p=plot3d(U(x,y),(x,0,2),(y,0,2),color='lightgreen',opacity=0.7,frame=False)
#for h in levels:
#    p+=implicit_plot3d(U(x,y)==h,(x,0,2),(y,0,2),(z,h,h+epsilon),color='red')
#    p+=implicit_plot3d(U(x,y)==h,(x,0,2),(y,0,2),(z,0,0.01),color='red')
from sage.manifolds.utilities import set_axes_labels
p+= arrow3d((0, 0, 0), (2.2, 0, 0), color='green')
p+= arrow3d((0, 0, 0), (0, 2.2, 0), color='green')
p+= arrow3d((0, 0, 0), (0, 0, 2.2), color='green')
p+=plot3d(B(x,y),(x,0,2),(y,0,2),color='pink',opacity=0.7,frame=False)
po2={'fontsize':20,'color':'black'}
t=text3d("x",(2.4,0,0),**po2)       
t+=text3d("y",(0,2.4,0.0),**po2)            
t+=text3d("U",(0.,0.0,2.4),**po2)
p+= text3d(r"U(x,y) = xᐧ⁵yᐧ⁵ ", (1, 1, 2.5), color=(0.5, 0, 0))
p+= set_axes_labels(p, r"x",r"y",r"z", color='lightgreen', fontweight='bold')
show(p,viewer='threejs',frame=False)

But I would like to add the intersection line of U and B in the plot. I have tried many solution without any success. Could some one gives a little help because I do not understand a word of https://ask.sagemath.org/question/33418/plot-the-intersection-of-two-surfaces-or-solutions-of-a-system-of-eqs/ which seems normal since it is written thas This post is a wiki. Anyone with karma > 750 is welcome to impove it

edit retag flag offensive close merge delete

2 Answers

Sort by » oldest newest most voted
2

answered 2023-04-30 09:54:55 +0200

achrzesz gravatar image

Consider also the following way

x, y, z = var("x, y, z")
def U(a, b): return sqrt(a)*sqrt(b)
def B(a, b): return a/16+b
p=plot3d(U, (0, 16), (0, 16), color="red") +\
plot3d(B, (0, 16), (-1, 16), color="blue",opacity=0.7) 
solve(U(x,y)^2==B(x,y)^2,y)

[y == -1/16*x*(4*sqrt(3) - 7), y == 1/16*x*(4*sqrt(3) + 7)]

sqr3=sqrt(3).n()
pp=[(x,1/16*x*(4*sqr3 + 7),sqrt(x)*sqrt(1/16*x*(4*sqr3 + 7)))
    for x in srange(0.0,16.0,1.0)]
p+=line3d(pp,color='yellow',radius=0.1)
pp1=[(x,-1/16*x*(4*sqr3 - 7),x/16-(1/16*x*(4*sqr3 - 7)))
    for x in srange(0.0,16.0,1.0)]
p+=line3d(pp1,color='yellow',radius=0.1)
p.rotateZ(pi/1.11).show(frame=False,aspect_ratio=[1,1,0.6])
edit flag offensive delete link more
0

answered 2023-04-27 01:09:33 +0200

Emmanuel Charpentier gravatar image

updated 2023-04-30 17:21:19 +0200

EDIT : Don't bother with what follows ; @achrzesz's answer to @Cyrille question is better ! I'm leaving this in place for the edification of future ask.sagemath.org (per-)users about the risks of obstination in the wrong direction.

Implicitly : try someting along the lines of :

plot3d(U, (0, 2), (0, 2), color="blue", opacity=0.5) +\
plot3d(B, (0, 2), (0, 2), color="yellow", opacity=0.5) +\
plot3d(U, (0, 2), (0, 2), color="red", plot_points=100).add_condition(lambda t, u, v:abs(v-B(t, u))<0.02)

Labeling and other seasonings left to the reader...

An explicit solution is necessarily numeric...

EDIT :

Using Python functions rather than Sage's "symbolic functions" (a. k. a. callable symbolic expressions) is way faster. After running :

# Python version
x, y, z = var("x, y, z")
# U(x,y) = x^(1/2)*y^(1/2)
# B(x,y) = (1/16)*x + y
def U(a, b): return sqrt(a)+sqrt(b)
def B(a, b): return a/16+b
def lu(e): return lambda a, b, c: abs(c-B(a, b))<=e
def lb(e): return lambda a, b, c: abs(c-U(a, b))<=e
def doit(e = 0.01, show_u = True,show_b = True, pp = 40, ppc = 100):
    if show_u: cu = lu(e)
    if show_b: cb = lb(e)
    doRu = lambda c, o, pp: plot3d(u,(0, 2), (0, 2), color=c, opacity=o, plot_points=pp)
    doRb = lambda c, o, pp: plot3d(b,(0, 2), (0, 2), color=c, opacity=o, plot_points=pp)
    R = doRu("blue", 0.2, pp) + doRb("yellow", 0.2, pp)
    if show_u:
        Cu = doRu("red", 1, ppc).add_condition(cu)
        R += Cu
    if show_b: 
        Cb = doRb("red", 1, ppc).add_condition(cb)
        R += Cb
    return R

A test run gives :

sage: %time doit(e=0.03, pp=200, ppc=200).show(frame=False, axes=True)
Launched html viewer for Graphics3d Object
CPU times: user 554 ms, sys: 32 ms, total: 586 ms
Wall time: 626 ms

image description

Using Cython might get you yet another speedup factor, making building an interact a viable proposition...

edit flag offensive delete link more

Your Answer

Please start posting anonymously - your entry will be published after you log in or create a new account.

Add Answer

Question Tools

1 follower

Stats

Asked: 2023-04-26 13:08:40 +0200

Seen: 244 times

Last updated: Apr 30 '23