Revision history [back]
| | 1 | initial version |
You may want (next time) to rearrange the code, so that it gets readable. Also, respecting PEP8 and PEP40 may let the reader feel the respect.
(I have rewrite, since the answer should be readable.)
The variable myplot is not defined, so i will ignore the lines with it and the followers.
kwargs = {
    'xmin' : -10 ,
    'xmax' : +10 ,
    'ymin' : -10 ,
    'ymax' : +10 ,
    'gridlines' : 'minor' ,
    'frame' : True ,
    'axes' : True ,
    'figsize' : (3, 3) ,
    'thickness' : 3 , }

p1 = plot(-sqrt(-x - 2) + 1, (x, -10, 8), **kwargs)
p2 = plot(-abs(x + 2) - 3, (x, -10, 10), **kwargs)
p3 = plot(-(x - 4)^3 + 1, (x, -10, 10), **kwargs)
p4 = plot(-.5*(x - 4)^2 + 1, (x, -10, 10), **kwargs)

# graphics_array(((p1, p2), (p3, p4))) # long time
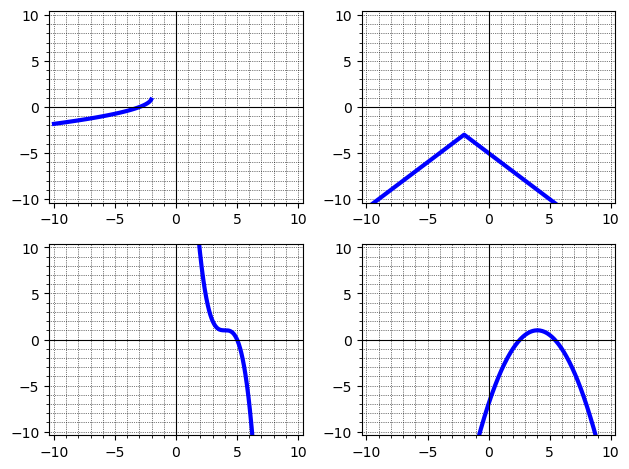
When this is done, sage sets some ranges for the $x$-variables, that should be relevant. For instance, the function involving the square root, $f(x)=-\sqrt{-x-2}$ is well defined as a real valued function on $[-10, -2]$, but for other values the graph is like a river in the desert, it is not reaching the ocean at the right boundary. We may ask for...
sage: p1.get_axes_range()
{'xmin': -10.0,
 'xmax': -2.035750064037735,
 'ymin': -1.8284271247461903,
 'ymax': 0.8109231266449151}
sage: p2.get_axes_range()
{'xmin': -10.0, 'xmax': 10.0, 'ymin': -15.0, 'ymax': -3.0000725445420926}
sage: p3.get_axes_range()
{'xmin': -10.0, 'xmax': 10.0, 'ymin': -215.0, 'ymax': 2745.0}
sage: p4.get_axes_range()
{'xmin': -10.0, 'xmax': 10.0, 'ymin': -97.0, 'ymax': 0.9999323671872665}
So these are the ranges of the functions, as sage considers to give a best picture for them. The function involving the cube is also leaving the box, sage gets corresponding axes range.
A plot so far is:
sage: graphics_array(((p1, p2), (p3, p4)))
Launched png viewer for Graphics Array of size 2 x 2
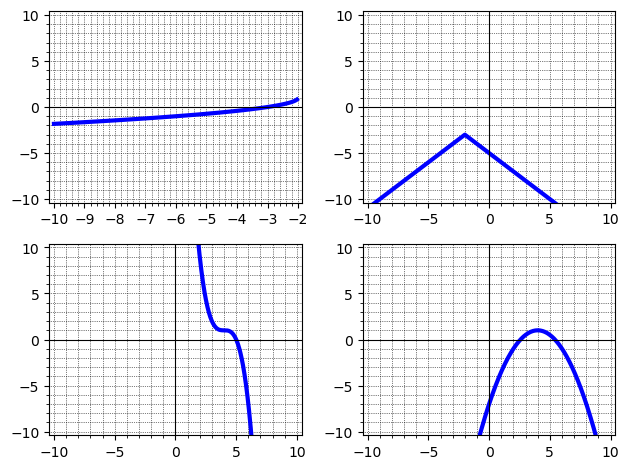
Now, if we insist to have p1 plotted within $[-10,10]^\times 2$, we have to set our own wish. We can do this in a loop:
for p in (p1, p2, p3, p4):
    p.set_axes_range(-10, 10, -10, 10)
If we ask again...
sage: p1.get_axes_range()
{'xmin': -10.0, 'xmax': 10.0, 'ymin': -10.0, 'ymax': 10.0}
sage: p2.get_axes_range()
{'xmin': -10.0, 'xmax': 10.0, 'ymin': -10.0, 'ymax': 10.0}
sage: p3.get_axes_range()
{'xmin': -10.0, 'xmax': 10.0, 'ymin': -10.0, 'ymax': 10.0}
sage: p4.get_axes_range()
{'xmin': -10.0, 'xmax': 10.0, 'ymin': -10.0, 'ymax': 10.0}
So the boxes are as we want them. And the new plot is: