Revision history [back]
| | 1 | initial version |
As asked, your question does not use any Sage specific function and uses Sage as a Python interpreter. It would probably better aimed at a Python list/forum.
But Sage has functions useful for this task. Given :
sage: var("Q,E0")
(Q, E0)
sage: K=1/(4*pi*E0) # Keep constant's definition.
sage: NumVals={Q:1,E0:8.854187817e-12} # Separate symbolic and numeric computations...
sage: f(x,y)=K*Q/sqrt(x^2+y^2) # define f symbolically.
You may compute :
sage: f.gradient()
(x, y) |--> (-1/4*Q*x/(pi*(x^2 + y^2)^(3/2)*E0), -1/4*Q*y/(pi*(x^2 + y^2)^(3/2)*E0))
i. e. a symbolic function of two variables returning a bidimensional vector, better typeset as :
$$ \left( x, y \right) \ {\mapsto} \ \left(-\frac{Q x}{4 \, \pi {\left(x^{2} + y^{2}\right)}^{\frac{3}{2}} E_{0}},\,-\frac{Q y}{4 \, \pi {\left(x^{2} + y^{2}\right)}^{\frac{3}{2}} E_{0}}\right) $$
Graphing needs numerical values, but having them in a dictionary allows to keep the working tools (definitions, equations, intermediate results...) symbolic (i. e. understandable) until numerical values are needed.
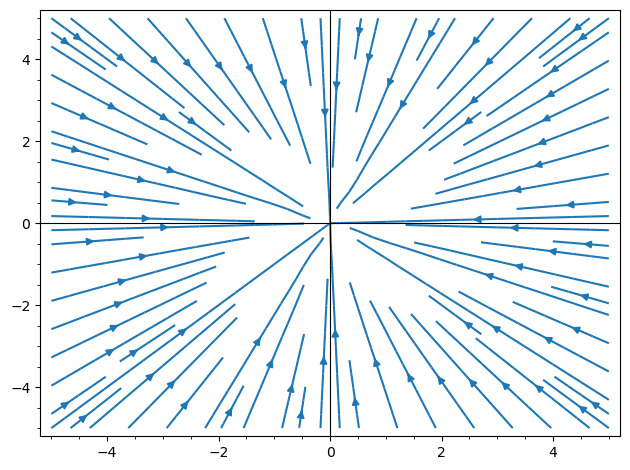
I'm not sure what Matplotlib's streamplot is supposed to do. I suppose its either :
sage: streamline_plot(f.gradient().subs(NumVals).list(), (-5, 5), (-5, 5))
Launched png viewer for Graphics object consisting of 1 graphics primitive
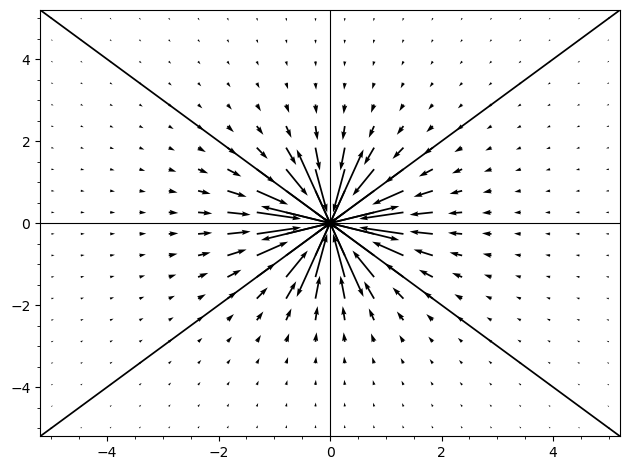
or, possibly,
sage: plot_vector_field(f.gradient().subs(NumVals), (x, -5, 5), (y, -5, 5))
Launched png viewer for Graphics object consisting of 1 graphics primitive
HTH,
