Revision history [back]
| | 1 | initial version | |

To add text to a plot, literally add the result of a call to text to the graphics object returned by plot:
sage: G = Graph([(0,1),(0,2),(0,3),(1,2),(1,3),(2,3)])
sage: G.plot(pos={ 0: (0,0), 1 : (1,0), 2: (0,1), 3: (1,1) }) + text("Hello",(0.75, 0.5))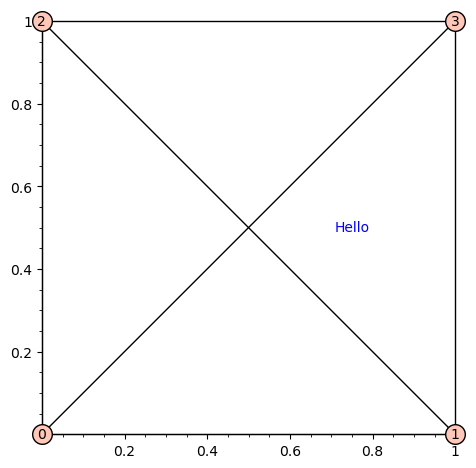
| | 2 | No.2 Revision |
To add text to a plot, literally add the result of a call to text to the graphics object returned by plot:
sage: G = Graph([(0,1),(0,2),(0,3),(1,2),(1,3),(2,3)])
sage:  G.plot(pos={ 0: (0,0), 1 : (1,0), 2: (0,1), 3: (1,1) }) },axes=False) + text("Hello",(0.75, 0.5))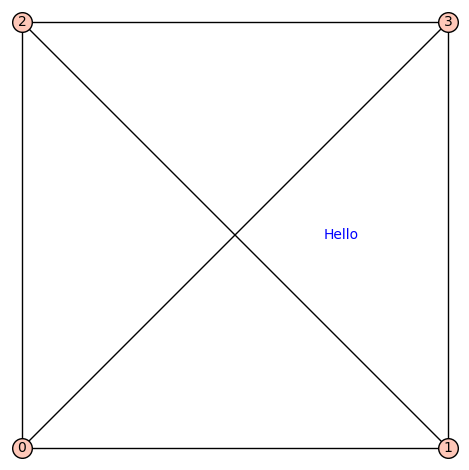
| | 3 | No.3 Revision |
To add text to a plot, literally add the result of a call to text to the graphics object returned by plot:
sage: G = Graph([(0,1),(0,2),(0,3),(1,2),(1,3),(2,3)])
sage:  G.plot(pos={ 0: (0,0), 1 : (1,0), 2: (0,1), 3: (1,1) },axes=False) + text("Hello",(0.75, 0.5))
