Revision history [back]
| | 1 | initial version | |

Consider the following code:
from sage.plot.plot3d.index_face_set import IndexFaceSet
from sage.plot.plot3d.texture import Texture

def project_xy_xz_yz(surf, position):
    oxy,oxz,oyz = position

    # Initialize surf as an IndexFaceSet
    surf.triangulate()

    # Vertices projected onto planes parallel to xy, xz and yz
    vxy_list = [(v[0],v[1],oxy) for v in surf.vertices()]
    vxz_list = [(v[0],oxz,v[2]) for v in surf.vertices()]
    vyz_list = [(oyz,v[1],v[2]) for v in surf.vertices()]

    # Compute projections. We have to consider whether or not
    # each face has its own color
    f_list = surf.index_faces()
    if surf.has_local_colors():
        f_data = surf.index_faces_with_colors()
        col_list = [Texture(color=item[1]) for item in f_data]
        pxy = IndexFaceSet(f_list,vxy_list,texture_list=col_list)
        pxz = IndexFaceSet(f_list,vxz_list,texture_list=col_list)
        pyz = IndexFaceSet(f_list,vyz_list,texture_list=col_list)
    else:
        texture = surf.get_texture()
        pxy = IndexFaceSet(f_list,vxy_list)
        pxy.set_texture(texture)
        pxz = IndexFaceSet(f_list,vxz_list)
        pxz.set_texture(texture)
        pyz = IndexFaceSet(f_list,vyz_list)
        pyz.set_texture(texture)

    # End function
    return [pxy, pxz, pyz]
This code defines a function, project_xy_xz_yz, which computes the projection of a surface, given by the first argument, onto planes parallel to the xy−, xz− and yz−planes. Specifically, if the second argument is [a,b,c], we get the projections onto the planes z=a, y=b and x=c. The functions used in the code are mostly documented here.
Let us test this function. Let us consider the surface z=2x+3y2(x2+y2+1)2 and plot it in the rectangle [−2,2]×[−2,2]. First, the surface will have a uniform color and will be a bit transparent. We add the projections onto planes parallel to xz and yz, which inherit the surface color. The orthographic projection will allow you to check that the projections match the surface.
var("x,y")
def f(x,y):
    return (2*x+3*y^2) / (x^2+y^2+1)^2

s1 = plot3d(f(x,y), (x,-2,2), (y,-2,2), color="lightgreen", opacity=0.6)
p1 = project_xy_xz_yz(s1,[-1,-3,-3])
show(s1+p1[1]+p1[2], aspect_ratio=[1,1,2], projection="orthographic")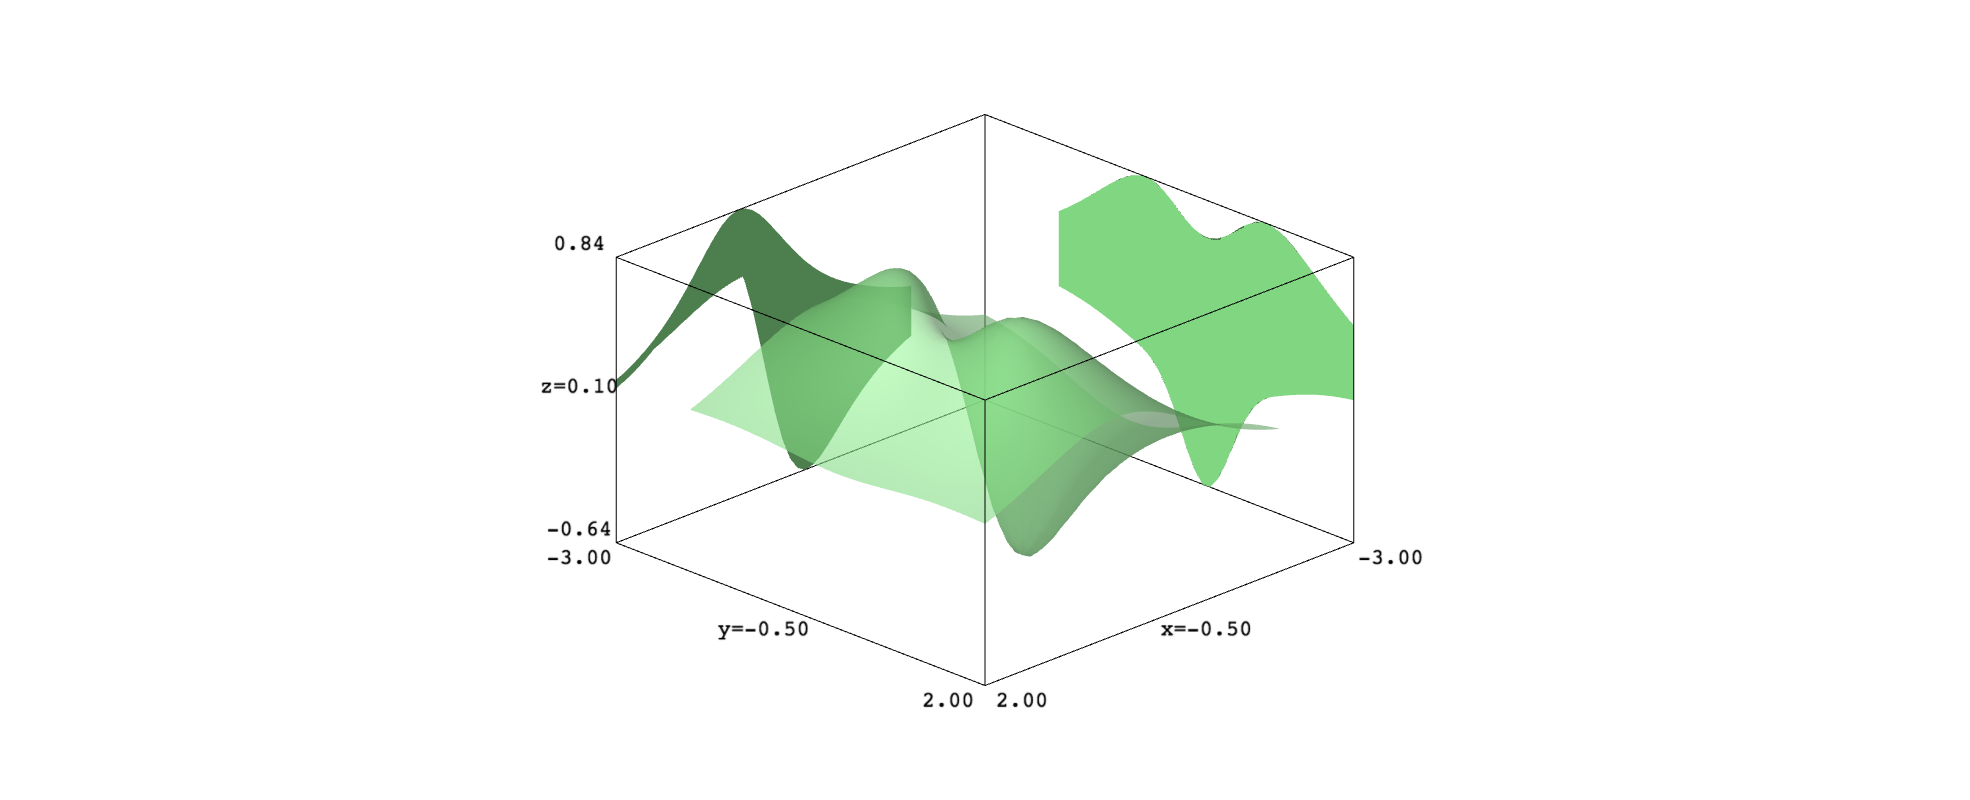
Now, let us get a full color picture and the three projections. Note that you can freely choose where locate the projection planes.
z1, z2 = -0.6, 0.8
def col(x,y):
    return float((f(x,y)-z1)/(z2-z1))

s2 = plot3d(f(x,y), (x,-2,2), (y,-2,2), color=(col,colormaps.coolwarm), plot_points=80)
p2 = project_xy_xz_yz(s2,[-1,3,3])
show(s2+sum(p2), aspect_ratio=[1,1,2], frame=False)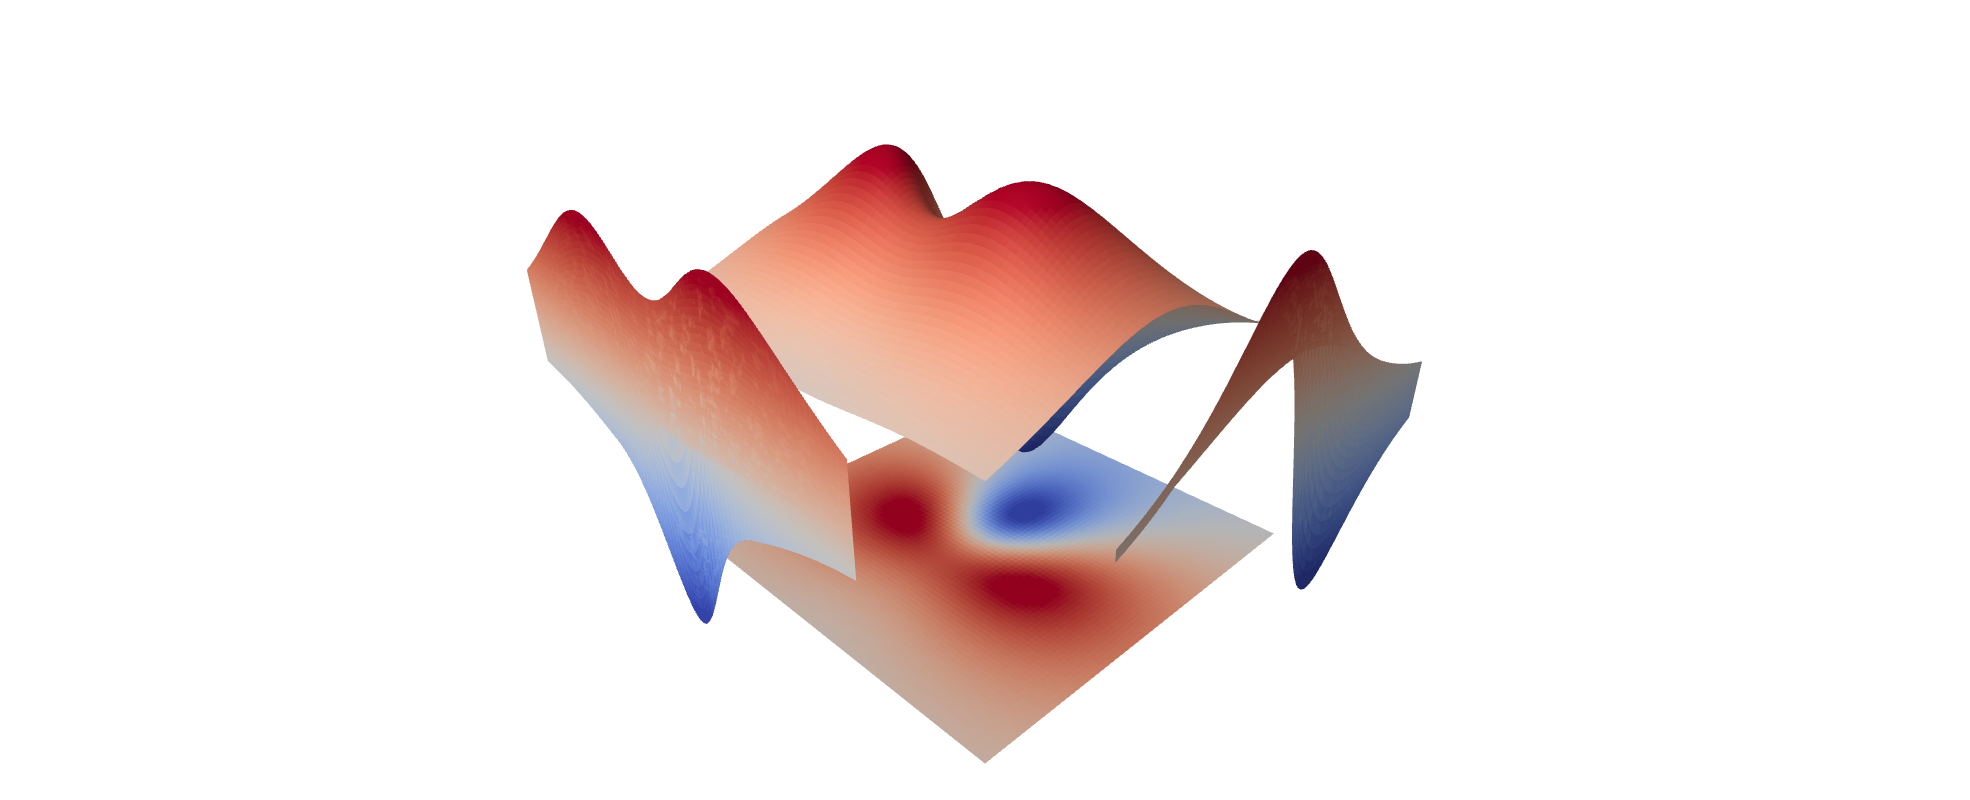
I think that the function extrema are easily seen in the projections.
You can play this examples in this SageMath cell.
