Revision history [back]
| | 1 | initial version |
Hello, @jamlatino! I had success with the following code:
a = octave.normrnd(50,3,100,1)
b = octave.hist(a)

bar_chart(b.sage()) # first convert the Octave object into a Sage object, and then plot
The idea behind this code is simple: When you create an Octave object, you cannot operate it with pure-Sage functions, so you have to transform the object to Sage representation first. That is what the sage() method does.
(Other software interfaces Sage defines, like maxima, GAP, etc. should have a sage() method too, for this same purpose.)
I hope this helps!
| | 2 | No.2 Revision |
Hello, @jamlatino! I had success with the following code:
a = octave.normrnd(50,3,100,1)
b = octave.hist(a)

bar_chart(b.sage()) # first convert the Octave object into a Sage object, and then plot
The idea behind this code is simple: When you create an Octave object, you cannot operate it with pure-Sage functions, so you have to transform the object to Sage representation first. That is what the sage() method does.
This is what I get in a particular run:
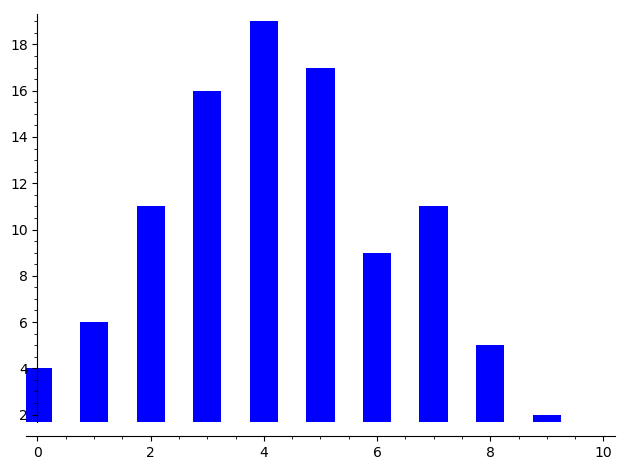
(Other software interfaces Sage defines, like maxima, GAP, etc. should have a sage() method too, for this same purpose.)
I hope this helps!
