Revision history [back]
| | 1 | initial version | |

Suppose that there are k ellipses and let Ri the bounded region limited by the ith-ellipse. Assume that Ri is given by the relation Ei(x,y)≤0. Consider the function S(x,y)=k∑i=1sgn(Ei(x,y)). For j=0,…,k, a point lying in the intersection of j regions Ri satisfies that S(x,y)=−j+(k−j)=k−2j. So, one has to plot the contours of S for the values −k,−k+2,−k+4,…,k to get the points lying in all regions Ri, in all but one regions, in all but two regions,..., in no region Ri, respectively. For example, consider the following code:
E1 = 3*x^2+5*x*y+8*y^2-2*x-30
E2 = x^2-5*x*y+7*y^2+x-3*y-2
E3 = 20*x^2+2*x*y+7*y^2+x-3*y-65
E4 = 6*x^2-5*x*y+28*y^2-2*x+3*y-70
fun = sum(sgn(EE) for EE in [E1,E2,E3,E4])
contour_plot(fun, (x,-5,5), (y,-5,5),contours=[-4,-2,0,2,4],
             plot_points=300, fill=True, cmap="Spectral", colorbar=True)
It yields this image:
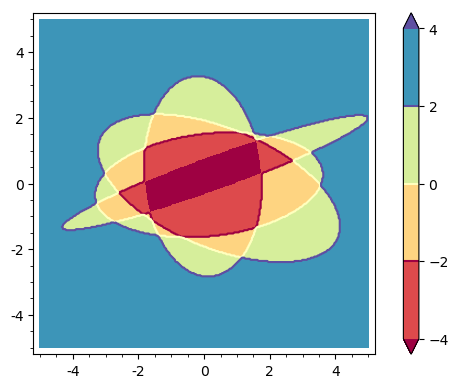
Blue points lie in no region bounded by an ellipse; green points lie in only one region; brown points lie in two regions; red points, in three regions; dark red points are the intersection of all regions Ri.
| | 2 | No.2 Revision |
Suppose that there are k ellipses and let Ri be the bounded region limited by the ith-ellipse. Assume that Ri is given by the relation Ei(x,y)≤0. Consider the function S(x,y)=k∑i=1sgn(Ei(x,y)). For j=0,…,k, a point lying in the intersection of j regions Ri satisfies that S(x,y)=−j+(k−j)=k−2j. So, one has to plot the contours of S for the values −k,−k+2,−k+4,…,k to get the points lying in all regions Ri, in all but one regions, in all but two regions,..., in no region Ri, respectively. For example, consider the following code:
E1 = 3*x^2+5*x*y+8*y^2-2*x-30
E2 = x^2-5*x*y+7*y^2+x-3*y-2
E3 = 20*x^2+2*x*y+7*y^2+x-3*y-65
E4 = 6*x^2-5*x*y+28*y^2-2*x+3*y-70
fun = sum(sgn(EE) for EE in [E1,E2,E3,E4])
contour_plot(fun, (x,-5,5), (y,-5,5),contours=[-4,-2,0,2,4],
             plot_points=300, fill=True, cmap="Spectral", colorbar=True)
It yields this image:
Blue points lie in no region bounded by an ellipse; green points lie in only one region; brown points lie in two regions; red points, in three regions; dark red points are the intersection of all regions Ri. Ri.
| | 3 | No.3 Revision |
Suppose that there are k ellipses and let Ri be the bounded region limited by the ith-ellipse. Assume that Ri is given by the relation Ei(x,y)≤0. Consider the function S(x,y)=k∑i=1sgn(Ei(x,y)). For j=0,…,k, a point lying in the intersection of j regions Ri satisfies that S(x,y)=−j+(k−j)=k−2j. So, one has to plot the contours of S for the values −k,−k+2,−k+4,…,k to get the points lying in all regions Ri, in all but one regions, in all but two regions,..., in no region Ri, respectively. For example, consider the following code:
E1 = 3*x^2+5*x*y+8*y^2-2*x-30
E2 = x^2-5*x*y+7*y^2+x-3*y-2
E3 = 20*x^2+2*x*y+7*y^2+x-3*y-65
E4 = 6*x^2-5*x*y+28*y^2-2*x+3*y-70
fun = sum(sgn(EE) for EE in [E1,E2,E3,E4])
contour_plot(fun, (x,-5,5), (y,-5,5),contours=[-4,-2,0,2,4],
             plot_points=300, fill=True, cmap="Spectral", colorbar=True)
It yields this image:
Blue points lie in no region bounded by an ellipse; green points lie in only one region; brown points lie in two regions; red points, in three regions; dark red points are the intersection of all regions Ri.
EDIT. In fact, a better and general approach is to plot the function S=k∑i=11Ri, where 1Ri stands for the characteristic function of Ri. The interesting contours are now 0,1,2,…,k.
For the above case, it is clear that 1Ri(x,y)=unit_step(−Ei(x,y)). Hence, with the same ellipses, the code
fun = sum(unit_step(-EE) for EE in [E1,E2,E3,E4])
contour_plot(fun, (x,-5,5), (y,-5,5), contours=[0..4],
             plot_points=300, fill=True, cmap="Spectral_r", colorbar=True)
yields this figure:
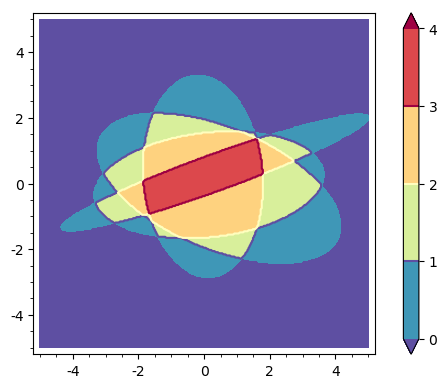
The color bar now directly says the number of regions to which a point belongs.
