Revision history [back]
| | 1 | initial version |
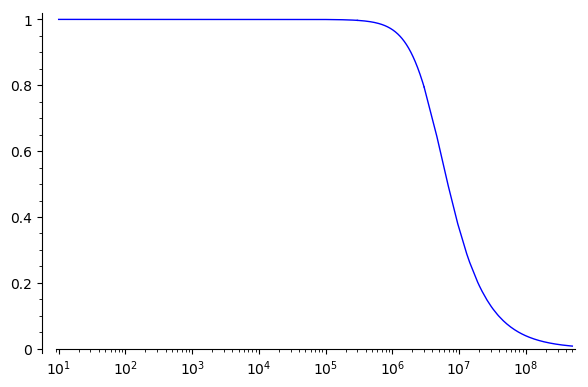
I was able to obtain a reasonably nice plot with:
plot(out(15, 2.7e-9), (10, 500e6), scale='semilogx', plot_points=2000)

Another way you could do it is break it up into multiple plots, with one plot adding more points just around the inflection point, like:
f_0 = out(15, 2.7e-9)
P = plot(f_0, (10, 3e5), scale='semilogx') # Just eyeballing it
P += plot(f_0, (3e5, 3e6), scale='semilogx')
P += plot(f_0, (3e6, 5e8))
P
which looks a tiny bit smoother.
Regardless, it could be nice if the automatic interpolation were better in this case. It's possible some other parameters could be adjusted to improve it but I'm not sure.
