dazedANDconfused's profile - activity
| 2023-05-20 02:34:03 +0200 | received badge | ● Civic Duty (source) |
| 2023-05-19 22:17:53 +0200 | answered a question | How to substitute a value into an expression without evaluation to convert it to LaTex? There are several ways to do it and you'll have to decide on which suits you best. First method: Direct use of sympy. Th |
| 2023-05-18 03:27:12 +0200 | edited answer | Code for guessing formula for integer sequence With respect to sequences, look into the Lagrange (interpolation) polynomial for a set points which is here in the docum |
| 2023-05-18 03:22:40 +0200 | edited answer | Code for guessing formula for integer sequence With respect to sequences, look into the Lagrange (interpolation) polynomial for a set points which is here in the docum |
| 2023-05-18 03:21:06 +0200 | answered a question | Code for guessing formula for integer sequence With respect to sequences, look into the Lagrange (interpolation) polynomial for a set points which is here in the docum |
| 2023-02-18 15:10:25 +0200 | commented answer | How to draw CubeGraph(5) better? Thanks, I didn't notice that. I use circular layout when I am not happy with positioning. I've edited my answer to show |
| 2023-02-18 15:08:14 +0200 | edited answer | How to draw CubeGraph(5) better? I use 3 useful tweaks in making graphs: 1. Adjust the vertex size, 2. Adjust the distance between vertices, 3. arrange t |
| 2023-02-18 04:41:55 +0200 | answered a question | How to draw CubeGraph(5) better? I'm not sure what you mean by overlapping vertices. The issue I see is that the labels are too big for the vertices. Wit |
| 2022-09-19 23:58:42 +0200 | commented answer | How to randomly generate a quadratic, monic, irreducible polynomial over ring of integers ZZ with small coefficients? Good idea! I revised code to do that. |
| 2022-09-19 23:58:00 +0200 | edited answer | How to randomly generate a quadratic, monic, irreducible polynomial over ring of integers ZZ with small coefficients? You haven't made it clear how big integers can be and still be small. The following code can easily be modified as neede |
| 2022-09-19 03:10:54 +0200 | edited answer | How to randomly generate a quadratic, monic, irreducible polynomial over ring of integers ZZ with small coefficients? You haven't made it clear how big integers can be and still be small. The following code can easily be modified as neede |
| 2022-09-19 03:09:44 +0200 | answered a question | How to randomly generate a quadratic, monic, irreducible polynomial over ring of integers ZZ with small coefficients? You haven't made it clear how big integers can be and still be small. The following code can easily be modified as neede |
| 2022-08-30 23:33:13 +0200 | commented answer | Plotting a periodic function Nice, +1: I especially like the one using trig functions. |
| 2022-08-30 00:08:29 +0200 | commented answer | Plotting a periodic function Yes, I was going to add another while loop which kept adding 2 for values <-1 if I needed to graph the negative porti |
| 2022-08-29 16:18:35 +0200 | marked best answer | Plotting a periodic function I want to plot a function that is abs(x) for -1<= x <= 1 and repeats to create a sawtooth shaped function. With the code The Sage sell server tells me the value is 0.300000000000000, which is what I want as h(4.3)=h(2.3)=h(.3)=abs(.3) However, when I tried to plot h(x) with The plot looks like abs(x), so that h(4.3) now appears to be 4.3. What has gone wrong? How can I properly plot the h(x) I want? EDIT: A points plot gives me the output I am expecting, which is different than |
| 2022-08-29 16:18:32 +0200 | commented answer | Plotting a periodic function Good explanation! It clears up some misunderstandings I had. |
| 2022-08-29 03:33:01 +0200 | edited question | Plotting a periodic function Plotting a periodic function I want to plot a function that is abs(x) for -1<= x <= 1 and repeats to create a sawt |
| 2022-08-29 02:54:24 +0200 | asked a question | Plotting a periodic function Plotting a periodic function I want to plot a function that is abs(x) for -1<= x <= 1 and repeats to create a sawt |
| 2022-05-13 20:21:30 +0200 | received badge | ● Taxonomist |
| 2022-03-04 16:56:36 +0200 | received badge | ● Nice Answer (source) |
| 2022-01-13 07:30:40 +0200 | received badge | ● Nice Question (source) |
| 2022-01-13 07:29:37 +0200 | marked best answer | Points making up a plot I'd like to get the list of points that make up a sage plot so I can process it through LaTeX (eg pgfplots) and get a better looking plot. This post here is essentially what I'm looking. I didn't really understand the code but came up with this: Change the function to f(x,y)=x^2+y^2 and the code works properly. But the example above only gives me the list of points for the left half of the hyperbola. How can I get the list of points when the graph is disconnected? Can that be extended to get the list of points if there are multiple graphs in the same plot? |
| 2021-03-12 13:17:59 +0200 | received badge | ● Popular Question (source) |
| 2021-01-01 21:53:54 +0200 | received badge | ● Popular Question (source) |
| 2020-12-19 03:13:24 +0200 | commented question | Graph plot: vertex attributes, node size, arrow head for loops, why are loops on nodes LaTeX make results look beautiful, Sage handles the math, and sagetex provides a way of using Sage en route to producing a graph like that. The quality of the image you have given is not possible in a Sage Cell Server. You said, "I do not understand how to set the vertex attributes, the size of the nodes, and so on.". That is covered in the documentation here. This page will show you the sort of output you should expect with just Sage. At the top of that page it gives you a link for LaTeX drawing of graphs. That page gives you output of LaTeX code. The output can be realized through LaTeX using |
| 2020-12-19 03:12:53 +0200 | answered a question | Graph plot: vertex attributes, node size, arrow head for loops, why are loops on nodes LaTeX is used to make results look beautiful, Sage handles the math, and sagetex provides a way of using Sage en route to producing a graph like that. The quality of the image you have given is not possible in a Sage Cell Server. You said, "I do not understand how to set the vertex attributes, the size of the nodes, and so on.". That is covered in the documentation here. This page will show you the sort of output you should expect with just Sage. At the top of that page it gives you a link for LaTeX drawing of graphs. That page gives you output of LaTeX code. The output can be realized through LaTeX using |
| 2020-12-18 05:06:01 +0200 | commented question | Graph plot: vertex attributes, node size, arrow head for loops, why are loops on nodes If you're interested in producing professional looking graphs then LaTeX is the way to go using the packages |
| 2020-11-16 01:42:13 +0200 | commented question | Is there any way to use SageMath on macOS Big Sur?? There's always Cocalc as well if you have an internet connection. |
| 2020-10-24 01:02:41 +0200 | answered a question | Tiny results of find root Those two roots are both approximations of 0. If possible, you should always seek to solve theoretically and numerically. If the answers agree then you feel confident everything was done correctly. If the answers disagree then you have to look deeper. The roots of the function are when it is equal to 0, so you need to solve the equation You mention inflection points but usually we calculate inflection points by taking the second derivative but from your answers I see you are setting the first derivative equal to 0. Where the derivative is 0 (or undefined) are usually called the critical values. If you rewrite the second answer as Which looks like:
There is no way to solve that equation analytically. However, since you know where, approximately, the roots are you can use |
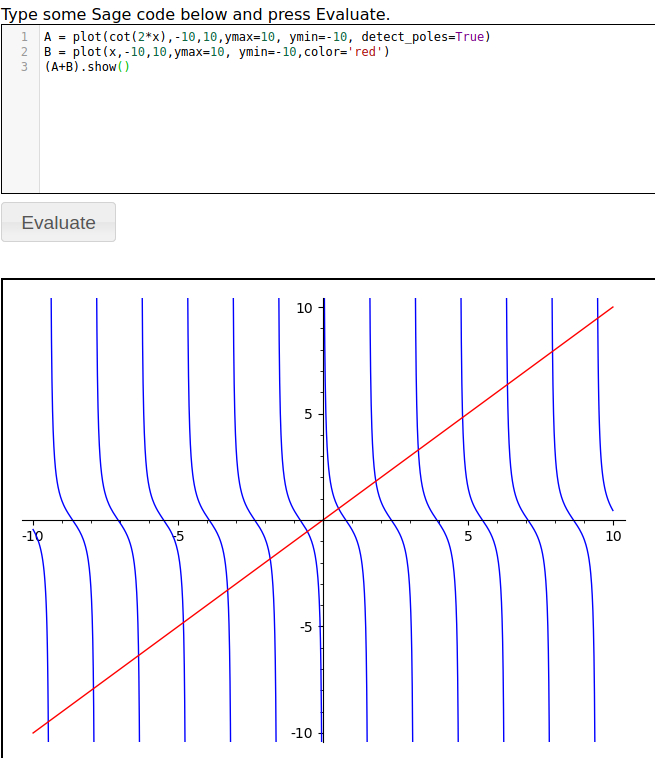
| 2020-10-20 02:38:18 +0200 | commented question | Why does plot choke on x to the 1/3 power, when it will calculate it just fine? Following the answers, both |
| 2020-10-20 00:39:00 +0200 | commented question | Why does plot choke on x to the 1/3 power, when it will calculate it just fine? This question has been covered before, see here. Remember your order of operation: exponentiation doesn't apply to the negative. You've taken a positive cube root and then made it negative. If you try |
| 2020-10-19 02:05:23 +0200 | commented answer | plot of sine, parabola intersection works but solve makes no sense Most equations have no clean solution and must be evaluated with numerical approximations. This is one of them. Even polynomials can cause problems. |
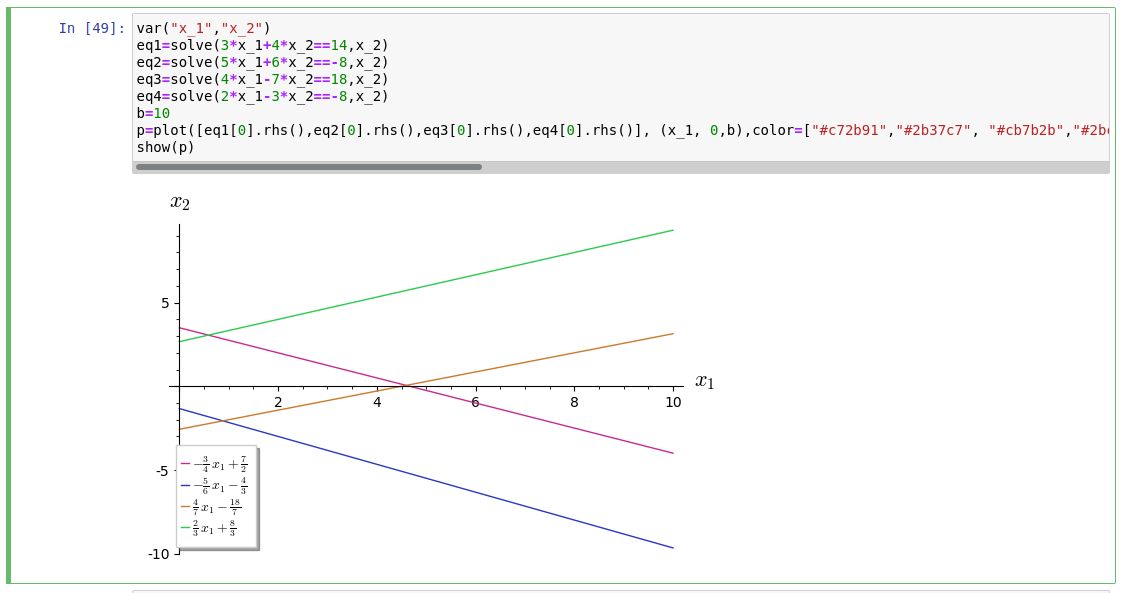
| 2020-10-08 03:01:20 +0200 | answered a question | Plot legend in latex from equations in Sagemath I fiddled around and got it to work by changing the This is the result:
Since there are several equations in the legend, I use a list. Looking at that part of the code,
It seems a bit awkward, maybe others have a more efficient way. |
| 2020-09-12 17:31:44 +0200 | commented question | Cocalc: change texmf.cnf file I've emailed Cocalc support for help. Should I delete this question? |