v_2e's profile - activity
| 2022-07-23 15:05:48 +0200 | received badge | ● Famous Question (source) |
| 2021-05-29 10:19:48 +0200 | received badge | ● Civic Duty (source) |
| 2020-06-17 15:19:19 +0200 | received badge | ● Famous Question (source) |
| 2020-05-24 07:18:15 +0200 | received badge | ● Famous Question (source) |
| 2020-04-18 20:44:43 +0200 | received badge | ● Notable Question (source) |
| 2020-01-13 22:52:40 +0200 | received badge | ● Notable Question (source) |
| 2019-03-23 14:00:22 +0200 | received badge | ● Famous Question (source) |
| 2018-10-23 10:52:48 +0200 | received badge | ● Famous Question (source) |
| 2018-08-26 19:25:51 +0200 | received badge | ● Popular Question (source) |
| 2018-04-01 22:09:50 +0200 | commented answer | Moving my Sage install (on Linux) This does not seem to work any more. At least, for the 8.1 version it does not. And the documentation now says "...once you have built Sage, you will not be able to move or rename its directory without likely breaking Sage." |
| 2018-04-01 22:06:46 +0200 | received badge | ● Popular Question (source) |
| 2018-03-03 12:47:12 +0200 | received badge | ● Notable Question (source) |
| 2018-03-03 12:47:12 +0200 | received badge | ● Famous Question (source) |
| 2017-10-27 15:59:02 +0200 | received badge | ● Notable Question (source) |
| 2017-10-27 15:59:02 +0200 | received badge | ● Popular Question (source) |
| 2017-10-27 15:59:02 +0200 | received badge | ● Famous Question (source) |
| 2017-09-10 00:27:41 +0200 | received badge | ● Famous Question (source) |
| 2017-06-27 19:27:29 +0200 | received badge | ● Famous Question (source) |
| 2017-04-17 02:01:29 +0200 | received badge | ● Famous Question (source) |
| 2017-02-03 00:32:45 +0200 | received badge | ● Famous Question (source) |
| 2017-01-10 07:38:51 +0200 | received badge | ● Famous Question (source) |
| 2016-07-20 09:14:04 +0200 | received badge | ● Popular Question (source) |
| 2016-06-24 21:38:09 +0200 | received badge | ● Famous Question (source) |
| 2016-06-20 03:28:25 +0200 | received badge | ● Popular Question (source) |
| 2016-06-20 03:28:25 +0200 | received badge | ● Notable Question (source) |
| 2016-02-18 23:06:58 +0200 | received badge | ● Notable Question (source) |
| 2016-02-02 13:37:32 +0200 | asked a question | Insert image into Graphics object Is it possible to insert an image (let's say, a PNG file) into a Graphics object containing some plots? I need to create a raster inset into a figure with the list_plot'ted curves. |
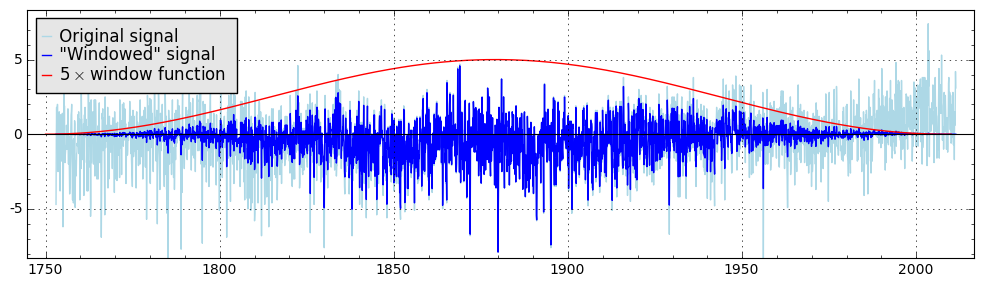
| 2015-07-03 21:08:35 +0200 | edited answer | Spectral density of a signal A self-answer: The power spectral density (PSD) may be defined as $ S(\omega) = \lim \limits_{T \to +\infty} \frac{\left \vert F_T(\omega) \right \vert ^2}{T} $, where $ F_T (\omega)$ is the Fourier transform defined as follows: $ {F}_T(\omega) = \int \limits_0^T f(t) \exp(-i\omega t) ~ dt$ The accepted data set format is: Calling for such signal will return the Power Spectral Density of a signal. Sometimes it is useful to apply some kind of window function to a signal prior to calculating the PSD, since the sharp start and end of the data record may produce some spurious spectral components. Here is an example of the popular Hanning Window application for the time series: The result of its application looks like this:
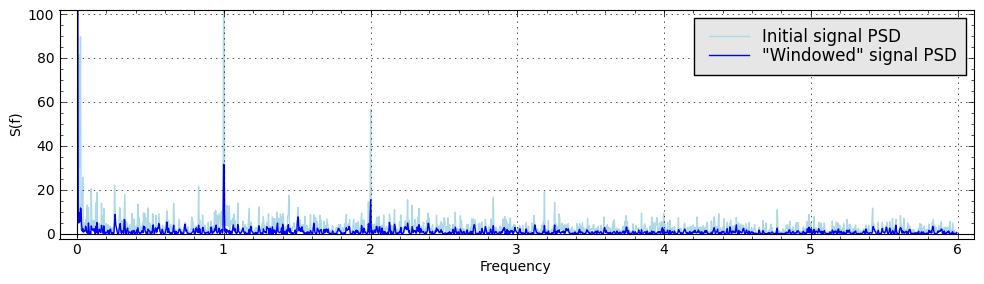
One can simply call to get the power spectral density for a data set with Hanning window function applied. You can compare the results of spectral density calculation for the initial time series and "windowed" time series:
|
| 2015-07-03 15:51:45 +0200 | received badge | ● Famous Question (source) |
| 2015-06-15 20:29:19 +0200 | commented answer | Two Y-axes @Jorge Why do you call this "mimic"? You are trying to use the Sage wrappers around Matplotlib functions, while I used those functions directly instead. That was the whole purpose of building such a long algorithm instead of the short one like yours. |
| 2015-06-15 20:19:58 +0200 | received badge | ● Notable Question (source) |
| 2015-05-11 21:18:28 +0200 | received badge | ● Notable Question (source) |
| 2015-03-27 04:12:17 +0200 | marked best answer | Markers in list_plot Hello! I discovered today that one cannot use the marker property with list_plot(). So I would like to know if this hasn't been implemented yet (but planned) or there is another way to be used? Thanks! Edit: I tried to use and it indeed let me use different form of markers, but in the case when DATA_LIST consists of only one element, the point placed incorrectly on the resulting plot. Edit 2: I remembered that there were some problems associated with the logarithmic scales on the axes. That is why I re-read this thread and realized that I have to add an axes_pad=0 parameter in order to get the correctly placed points. So the resuling work-around for a loglog scale would look like this: |
| 2015-03-27 04:11:55 +0200 | marked best answer | Plot a list of 3D data Hello! I have a task to plot a list of 3D data of the following form: It looks like with "list_plot3d()" I can only get a surface, while I need just the dots with the appropriate coordinates (x, y, z). How can I do that? |
| 2015-03-27 04:11:52 +0200 | marked best answer | Easy way to get repeatable random number sequences. Hello! Thanks. |
| 2015-03-27 04:09:53 +0200 | marked best answer | Two Y-axes Hello! Could somebody please point me to a way of plotting two curves associated with different y-axes? I need to plot two curves with different scale over the y-axis to compare their form. What I was thinking of is having two separate y-axes on both sides of a plot and associating one of the curves with the left axis and the other one - with the right axis. Is that possible? Thank you. |
| 2015-03-27 04:09:12 +0200 | marked best answer | Cyrillic text on the plot Is it possible to add the Cyrillic text to the plot in Sage Notebook? Currently I am trying to do somethink of this kind: Sage gives the error message: If I add the 'u' symbol before the string I can only see the empty rectangles instead of the letters. P.S. I saw this question, however, I am more interested in not using Matplotlib directly if possible. |
| 2015-03-27 04:08:43 +0200 | marked best answer | Dealing with 'NaN' values in lists Hello! Maybe somebody here has an experience on working with 'NaN' values in Sage. My situation is the following: I need to load some experimentally measured data into a list of float values. But unfortunately, the experimental data set is not "solid" - it has 'NaN' values somewhere inside. What I currently need to perform first of all is to calculate the average value of a list slice. Preferably, simply using 'mean()' if it is possible. So could somebody please give me an advice how to work with such arrays correctly? Thank you. |
| 2015-03-27 04:08:37 +0200 | marked best answer | Gauss distribution fit Hello! I have a problem with fitting my data set with a Gauss (Normal) distribution. gives a result: I tried to use a Python function instead of the symbolic one: and obtained the very same result: Why does it give me this (obviously, incorrect) result? And what is a way to do it right? Thanks. |
| 2015-03-27 04:08:14 +0200 | marked best answer | tseriesChaos package for R from Sage Notebook Hello! I need some nonlinear time series analysis functionality, which, as I've learnt from Internet, is provided by the 'tseriesChaos' package for R. I tried to use it from inside the Sage Notebook (one of the public servers) like this: and got the following error message: This variant: gave almost the same: So it looks like there is no 'tseriesChaos' package in a default Sage installation. So, how is it possible to use it? And how is it probable for the 'tseriesChaos' package to be included into Sage by default? Thanks. |
| 2015-03-27 04:07:35 +0200 | marked best answer | 3d plots without Java Hello! Is it possible to get a "static" plot of 3D-data? For example, if I state the fixed angles of view and want to get simply a PNG file. Maybe something like the command gives. If it isn't implemented in Sage right now, is it planned? Thanks. |
| 2015-03-27 04:07:31 +0200 | marked best answer | Does HTTP login to Sage Notebook send plaintex password? Does my web-browser send the login and password in plaintext when I login to Sage Notebook via HTTP protocol? |
| 2015-03-27 04:07:07 +0200 | marked best answer | interpolated 2D plot Hello! Is there a way to create a plot from a list of data using some kind of non-linear interpolation (e.g. splines) between the data points? Thanks. |
| 2015-03-14 18:49:34 +0200 | marked best answer | Spectral density of a signal Hello! Could somebody please help me find a way to build the spectral density function for a given signal in Sage? Thank you! |
| 2015-03-14 18:47:46 +0200 | received badge | ● Notable Question (source) |
| 2015-03-02 20:00:53 +0200 | received badge | ● Notable Question (source) |