ninho's profile - activity
| 2024-02-21 12:53:04 +0200 | received badge | ● Notable Question (source) |
| 2024-02-21 12:53:04 +0200 | received badge | ● Popular Question (source) |
| 2023-10-20 15:24:51 +0200 | received badge | ● Notable Question (source) |
| 2023-10-20 15:24:51 +0200 | received badge | ● Popular Question (source) |
| 2023-10-17 20:05:48 +0200 | received badge | ● Notable Question (source) |
| 2023-07-23 08:02:34 +0200 | received badge | ● Notable Question (source) |
| 2023-07-23 08:02:34 +0200 | received badge | ● Popular Question (source) |
| 2023-05-02 21:20:05 +0200 | received badge | ● Famous Question (source) |
| 2023-05-02 21:20:05 +0200 | received badge | ● Notable Question (source) |
| 2023-01-10 02:28:47 +0200 | received badge | ● Famous Question (source) |
| 2022-12-17 20:04:50 +0200 | marked best answer | How to properly time Sage computations? I have written a Sage code that performs some calculations with elliptic curves, and I want to get how much time it took to finish the calculations. I saw that there is already a function called timeit, but what I see is that it basically times the given command. Instead what I need is that I want to time the execution of certain code block (for example, a loop). Assuming, I have a code segment as this: How can I get how much time it took to execute the code block (in this case the whole loop)? |
| 2022-07-30 11:02:56 +0200 | marked best answer | Quadratic extension field of a finite field I want to create a quadratic extension of a finite field via Though, the above code throws a rather cryptic error |
| 2022-03-12 00:38:19 +0200 | received badge | ● Popular Question (source) |
| 2022-02-20 18:26:47 +0200 | received badge | ● Notable Question (source) |
| 2021-10-20 13:15:57 +0200 | received badge | ● Famous Question (source) |
| 2021-10-14 10:22:29 +0200 | received badge | ● Famous Question (source) |
| 2021-04-18 12:36:24 +0200 | received badge | ● Notable Question (source) |
| 2021-04-18 12:36:24 +0200 | received badge | ● Popular Question (source) |
| 2021-03-31 10:44:14 +0200 | received badge | ● Popular Question (source) |
| 2021-01-14 18:44:31 +0200 | received badge | ● Popular Question (source) |
| 2020-08-28 03:34:30 +0200 | received badge | ● Famous Question (source) |
| 2020-08-18 07:50:59 +0200 | received badge | ● Famous Question (source) |
| 2020-03-30 14:50:22 +0200 | received badge | ● Popular Question (source) |
| 2020-03-08 22:48:38 +0200 | received badge | ● Notable Question (source) |
| 2020-02-16 18:21:07 +0200 | received badge | ● Notable Question (source) |
| 2020-02-16 18:21:07 +0200 | received badge | ● Popular Question (source) |
| 2019-12-25 15:28:10 +0200 | received badge | ● Notable Question (source) |
| 2019-05-24 22:01:04 +0200 | received badge | ● Popular Question (source) |
| 2019-04-08 12:12:00 +0200 | received badge | ● Popular Question (source) |
| 2019-02-09 09:49:13 +0200 | received badge | ● Notable Question (source) |
| 2018-12-02 06:14:03 +0200 | received badge | ● Popular Question (source) |
| 2018-11-10 13:50:15 +0200 | received badge | ● Famous Question (source) |
| 2018-09-26 23:03:52 +0200 | received badge | ● Notable Question (source) |
| 2018-09-15 23:50:41 +0200 | asked a question | How to load local PARI/GP script in Sage notebook? I have a PARI/GP script which I want to load and run locally on my laptop inside a Sage notebook. I tried to open a new notebook in the same directory where my script is located, and run this: But, it throws the following error:
Please note that I'm using Sage 8.3. How can I run a PARI/GP script locally? |
| 2018-07-19 16:00:11 +0200 | received badge | ● Popular Question (source) |
| 2018-05-31 12:21:12 +0200 | received badge | ● Popular Question (source) |
| 2018-03-05 18:41:24 +0200 | commented question | How to plot similarity of two data sets in Sage? @j.c. Yes, |
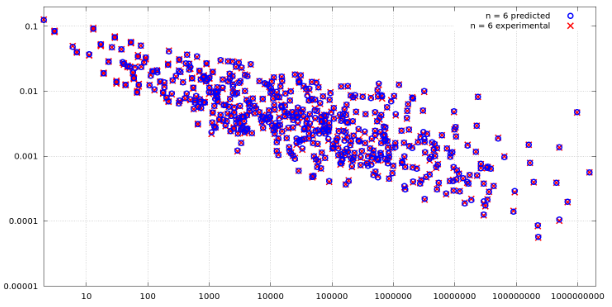
| 2018-03-05 16:35:11 +0200 | asked a question | How to plot similarity of two data sets in Sage? I'm performing some simulations, and at the end I have a CSV file with three columns. One column holds the values for the x-axis, which was also input to the simulation and theoretical calculations, second one holds theoretically expected values, and the other column holds the values obtained by the simulation. I was planning to plot something like this:
But that does not look good in my case, as the values in y-axis normally double, and the values for the x-axis exponentially increase, so most of the points end up getting collected at the lower left part, near the intersection of x-axis and y-axis of the plot. Therefore, I need a different way to plot such data, which will be more visually appealing and inform how close the simulation results are to the theoretical expected ones. For example, some of my values can be seen below: What is a good way to plot such a data that doubles in the y-axis and exponentially increases on the x-axis all the time, and to view how similar the two datasets actually are? |
| 2018-03-05 10:42:04 +0200 | marked best answer | How to specify x and y axis values in Sage plot? So, I have three lists in Sage, and I want to combine two list plots, where in one of them I have the expected values, and in the other one I have the simulation results, and the third one is the x-axis values that corresponds to these points. So my lists (all same size), look like this: Now, this creates a plot, and the y-axis corresponds to the values in |