Neabfi's profile - activity
| 2015-12-23 15:53:45 +0200 | commented answer | Plot in a function Thanks ! If I call several times the function, how can I concatenate the graphics to show them in one graph ? |
| 2015-12-23 15:47:00 +0200 | commented question | Plot in a function Sorry, I have edited my post. |
| 2015-12-23 15:46:32 +0200 | received badge | ● Editor (source) |
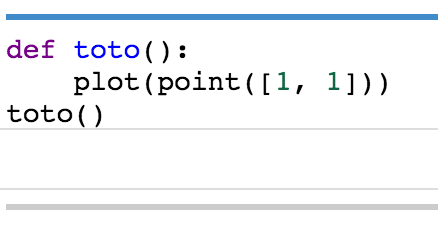
| 2015-12-23 15:37:31 +0200 | commented question | Plot in a function All the code is in the pictures. :( |
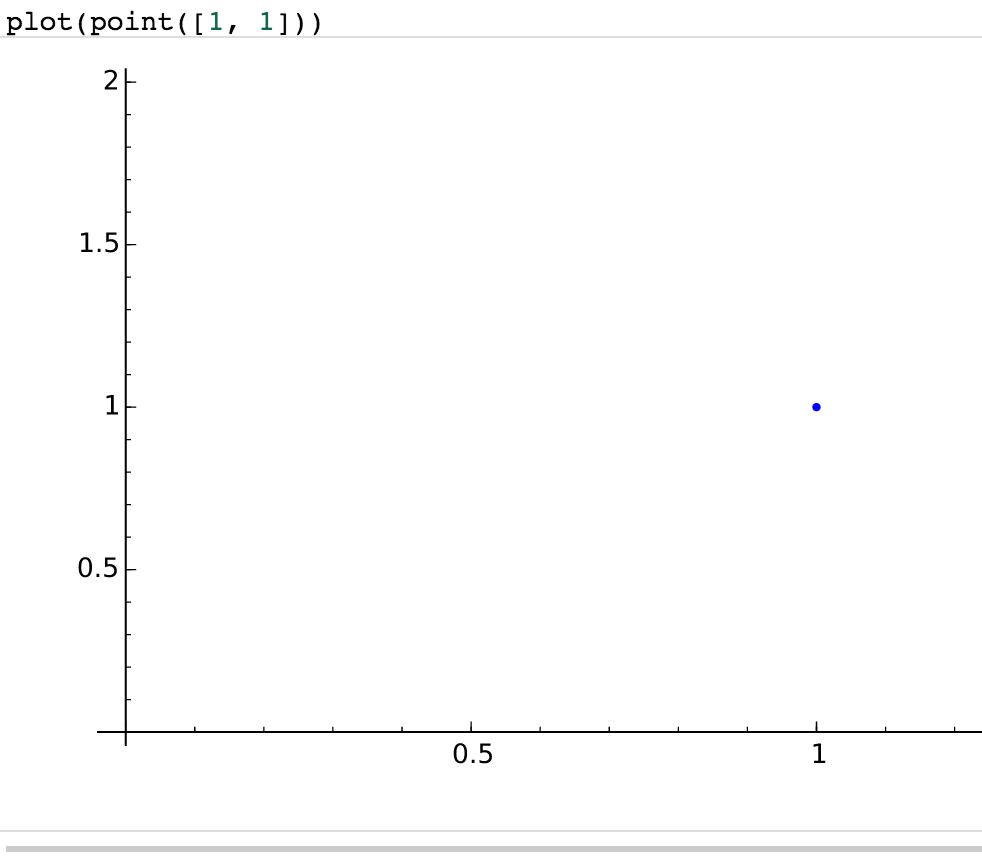
| 2015-12-23 13:54:43 +0200 | asked a question | Plot in a function Hello, Is it normal that i can't plot in a function ? Without a function:
With a function:
Thanks in advance ! |
| 2015-12-21 00:16:21 +0200 | received badge | ● Scholar (source) |
| 2015-12-19 23:23:36 +0200 | received badge | ● Student (source) |
| 2015-12-19 19:14:28 +0200 | asked a question | Best way to represent a point Hello, I have a point p1(x1, y1) and a point p2(x2, y2). For example I want p1 = 2 * p2 For the moment I store the points in lists so I have to do like: p1[0] = 2 * p2[0] p1[1] = 2 * p2[1] It's very ugly. What's the best way to do that ? Thanks in advance |