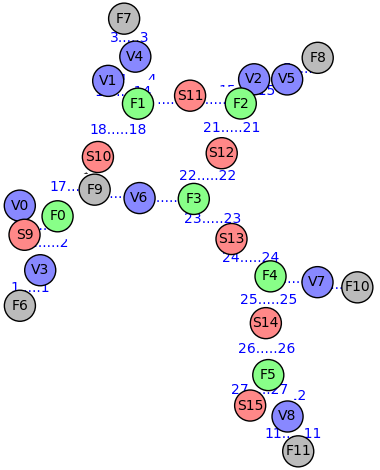
I'm trying to plot a graph.
The vertices are placed too close to each-other, so that i cant read the edge labels.
Is there a way to specify a minimum edge length?
Here are an example of how the labels are hard to read.
Sage code (also posted at codepad):
msg_list =  [('F6', 'V3'), ('V3', 'F0'), ('F7', 'V4'), ('V4', 'F1'),
('F8', 'V5'), ('V5', 'F2'), ('F9', 'V6'), ('V6', 'F3'), ('F10', 'V7'),
('V7', 'F4'), ('F11', 'V8'), ('V8', 'F5'), ('V0', 'F0'), ('V1', 'F1'),
('V2', 'F2'), ('S9', 'F0'), ('F0', 'S10'), ('S10', 'F1'), ('F1', 'S11'),
('S11', 'F2'), ('F2', 'S12'), ('S12', 'F3'), ('F3', 'S13'), ('S13',
'F4'), ('F4', 'S14'), ('S14', 'F5'), ('F5', 'S15')]

c =  {'#BBBBBB': ['F6', 'F7', 'F8', 'F9', 'F10', 'F11'], '#8888FF':
['V0', 'V1', 'V2', 'V3', 'V4', 'V5', 'V6', 'V7', 'V8'], '#FF8888':
['S9', 'S10', 'S11', 'S12', 'S13', 'S14', 'S15'], '#88FF88': ['F0',
'F1', 'F2', 'F3', 'F4', 'F5']}

G_forward = DiGraph([], loops=False, multiedges=False)
msg_nr = 1
for v_from, v_to in msg_list:
    G_forward.add_edge((v_from, v_to), label=str(msg_nr) + "....." + str(msg_nr))
    msg_nr += 1

G_forward.plot(layout="spring", edge_labels=True, vertex_size=500,
vertex_colors=c).show()
Result

The result as seen on SageCell


