Ask Your Question

Revision history [back]

How do I define the function to be 0 at x=0?

Struggling first-year undergrad here... sorry if this question seems stupid.

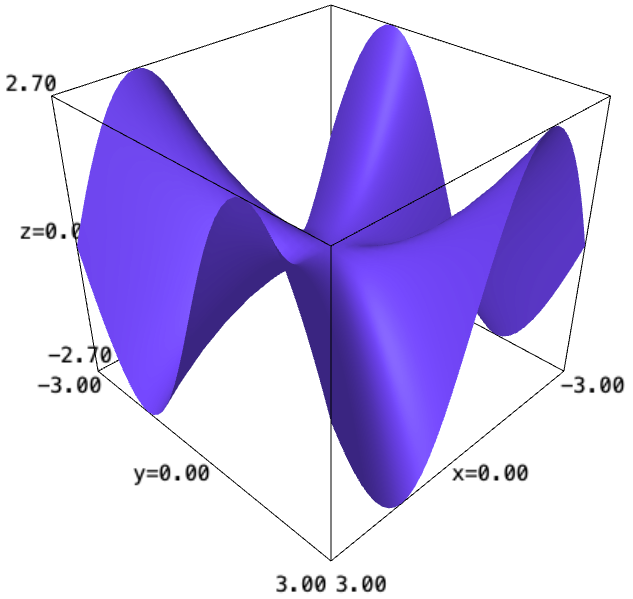
I want to graph the 3d and contour plots of f(x,y)=xy(x^2-y^2))/(x^2+y^2). Since the function is undefined at 0 I need to also define the function to be 0 at x=0.

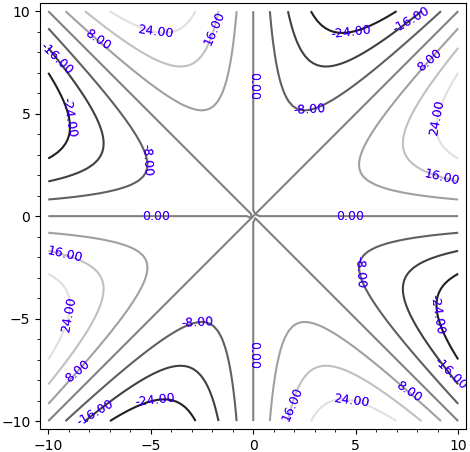
Here's what I wrote x,y=var ('x y') plot3d((xy(x^2-y^2))/(x^2+y^2),(-3,3),(-3,3) contour_plot((xy(x^2-y^2))/(x^2+y^2),(-10,10),(-10,10),fill=0,labels=40) The contour plot looks a bit funky, there's a big cross made by two lines at the origin which I suppose is because the function is undefined at 0.

image description

How do I define the function to be 0 at x=0?

Struggling first-year undergrad here... sorry if this question seems stupid.

I want to graph the 3d and contour plots of f(x,y)=xy(x^2-y^2))/(x^2+y^2). f(x,y)=x*y*(x^2-y^2))/(x^2+y^2). Since the function is undefined at 0 I need to also define the function to be 0 at x=0.

Here's what I wrote x,y=var ('x wrote

x, y = var('x y')
plot3d((xy(x^2-y^2))/(x^2+y^2),(-3,3),(-3,3)
contour_plot((xy(x^2-y^2))/(x^2+y^2),(-10,10),(-10,10),fill=0,labels=40)
plot3d((x*y*(x^2-y^2))/(x^2+y^2), (-3, 3), (-3, 3))

SageMath: 3D plot

contour_plot((x*y*(x^2-y^2))/(x^2+y^2), (-10, 10), (-10, 10), fill=0, labels=40)

SageMath: contour plot

The contour plot looks a bit funky, there's a big cross cross made by two lines at the origin which I suppose suppose is because the function is undefined at 0.

image description