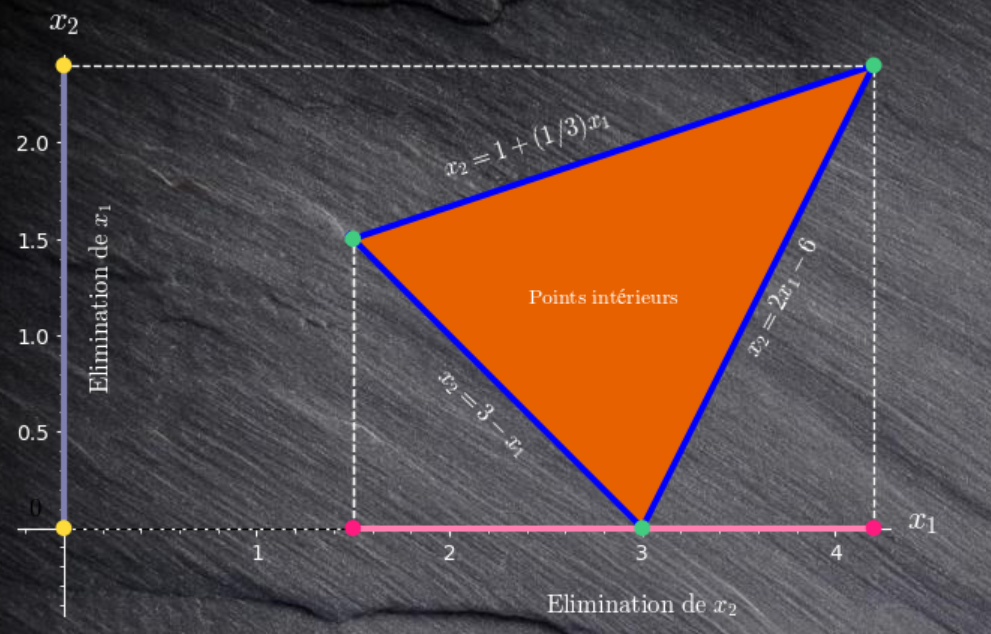
This question is about the solution of solve_ineq(). Here is a simple system of 3 equations :
$x+y >= 3$, $2x-y <=6$ and $3 x-y <= 3$. The graphical representation is given by
f0(x)=3-x
f1(x)=2*x-6
f2(x)=1+(1/3)*x
p=plot(f0(x),x,1.48,3,thickness=3,ticks=None)
p+=plot(f1(x),x,3,4.2,thickness=3,ticks=None)
p+=plot(f2(x),x,1.48,4.2,thickness=3,ticks=None)
sol0=solve(f0==f1,x)
sol1=solve(f0==f2,x)
sol2=solve(f1==f2,x)
p+=point((sol0[0].rhs(),f1(sol0[0].rhs())), rgbcolor=(0.26, 0.80, 0.50),size=60, zorder=10,axes_labels=['$x_1$','$x_2$'])
p+=point((sol1[0].rhs(),f2(sol1[0].rhs())), rgbcolor=(0.26, 0.80, 0.50),size=60, zorder=10)
p+=point((sol2[0].rhs(),f1(sol2[0].rhs())), rgbcolor=(0.26, 0.80, 0.50),size=60, zorder=10)
p+=point((0,f2(sol2[0].rhs())), rgbcolor=(0.99, 0.86, 0.23),size=60, zorder=10)
p+=point((0,0), rgbcolor=(0.99, 0.86, 0.23),size=60, zorder=10)
p+=line([(0,0),(0,f2(sol2[0].rhs()))],rgbcolor=(.5, 0.5, 0.69),thickness=3, zorder=8)
p+=point((sol1[0].rhs(),0), rgbcolor=(1, 0.1, 0.5),size=60, zorder=10)
p+=point((sol2[0].rhs(),0), rgbcolor=(1, 0.1, 0.5),size=60, zorder=10)
p+=line([(sol1[0].rhs(),0),(sol2[0].rhs(),0)],rgbcolor=(1, 0.5, 0.69),thickness=3, zorder=8)
p+=polygon([(sol0[0].rhs(),f1(sol0[0].rhs())),(sol1[0].rhs(),f2(sol1[0].rhs())),(sol2[0].rhs(),f1(sol2[0].rhs()))], rgbcolor=(0.9098, 0.3804, 0))
p+=text("$\\mathrm{Points }\\,\\, \\mathrm{intérieurs}$",(2.8,1.2),color='white')
p+=text("$x_2=3-x_1$",(1.9,.6),rotation=-44.0, horizontal_alignment='left',color='white',fontsize=12)
p+=text("$x_2=2x_1-6$",(3.5,1.2),rotation=62.0, horizontal_alignment='left',color='white',fontsize=12)
p+=text("$0$",(-.15,0.1), horizontal_alignment='center',color='black',fontsize=12)
p+=text("$x_2=1+(1/3)x_1$",(2.4,2.),rotation=18.0, horizontal_alignment='center',color='white',fontsize=12)
p+=text(r"$\mathrm{Elimination}\,\, \mathrm{de}\,\, x_1$",(0.2,1.2),rotation=90.0, horizontal_alignment='center',color='white',fontsize=12)
p+=text(r"$\mathrm{Elimination}\,\, \mathrm{de}\,\, x_2$",(3,-0.4),rotation=0.0, horizontal_alignment='center',color='white',fontsize=12)
p+=line([(sol1[0].rhs(),0),(sol1[0].rhs(),f2(sol1[0].rhs()))],linestyle="--",color='white')
p+=line([(sol1[0].rhs(),0),(sol1[0].rhs(),f2(sol1[0].rhs()))],linestyle="--",color='white')
p+=line([(sol2[0].rhs(),0),(sol2[0].rhs(),f2(sol2[0].rhs())), (0,f2(sol2[0].rhs()))],linestyle="--",color='white')
p+=line([(0,0), (sol1[0].rhs(),0)],linestyle="--",color='black', zorder=8)
p.axes_color('white')
p.axes_label_color('white')
p.tick_label_color('white')
show(p,aspect_ratio=1,transparent=True,ticks=None)

The graphic shows clearly the interval of validity when $x$ is eliminated or when it's $y$. Now I use solve_ineq() which, if I understand use Maxima Fourier_Motzkin implementation on the same sytem :
var('x y') #déclarer x est facultatif
sol0=solve_ineq([x + y >= 3, 2*x - y <=6, 3*y-x <=3],[x,y])
show(sol0)
sol0[2]
As you can see the solution display the 3 points which are the vertices of the polygon. But if you look at sol0[2], if I am not wrong there is a big mistake because the interval conditions are on $y$ when obviously, according the the graphics and my hand written calculations it should be on $x$

His this an error of mine or a bugg ?

