Ask Your Question

Revision history [back]

click to hide/show revision 1
initial version

Sage won't plot more than two plains

Hello, Sage community!

I have the following code that shows the solution of a 3x3 system of equations as an interact:

A = matrix(RR, 3, 3, [2,1,1,1,-2,1,1,3,-2] )
var('x y z')

@interact
def sol_3ecu_3inc(k1 = slider(-5, 5, 0.1, -1), k2 = slider(-5, 5, 0.1, -2), k3 = slider(-5, 5, 0.1, -3)):

    bvec = vector(RR, [k1, k2, k3])
    xvec = A \ bvec

    augmented_matrix = A.augment(bvec, subdivide=True)

    RADIUS = 6

    myplot  = implicit_plot3d(2*x + y + z == k1, (x,-RADIUS,RADIUS), (y,-RADIUS,RADIUS), (z,-RADIUS,RADIUS), color='red', opacity=0.1)
    myplot += implicit_plot3d(x - 2*y + z == k2, (x,-RADIUS,RADIUS), (y,-RADIUS,RADIUS), (z,-RADIUS,RADIUS), color='yellow', opacity=0.1)
    myplot += implicit_plot3d(x + 3*y - 2*z == k3, (x,-RADIUS,RADIUS), (y,-RADIUS,RADIUS), (z,-RADIUS,RADIUS), color='blue', opacity=0.1) 
    myplot += point3d((xvec[0], xvec[1], xvec[2]), color='black', size=100)

    myplot += line3d([(-RADIUS,0,0), (+RADIUS,0,0)], thickness=3, color='orange')
    myplot += line3d([(0,-RADIUS,0), (0,+RADIUS,0)], thickness=3, color='orange')
    myplot += line3d([(0,0,-RADIUS), (0,0,+RADIUS)], thickness=3, color='orange')

    show(myplot)

The result should look like this: image description
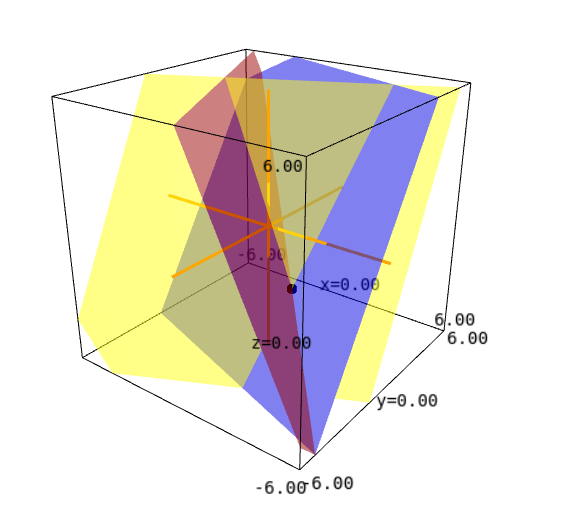
When I run this code in CoCalc or my own SageMath local installation, it works perfectly. However, if I try to execute this in sagecell.sagemath.org, Sage won't be willing to plot this. However, if I delete one the implicit_plot3d commands, the plot magically appears.

Can somebody explain this? Is this reproducible for other users?

click to hide/show revision 2
None

Sage won't plot more than two plains

Hello, Sage community!

I have the following code that shows the solution of a 3x3 system of equations as an interact:

A = matrix(RR, 3, 3, [2,1,1,1,-2,1,1,3,-2] )
var('x y z')

@interact
def sol_3ecu_3inc(k1 = slider(-5, 5, 0.1, -1), k2 = slider(-5, 5, 0.1, -2), k3 = slider(-5, 5, 0.1, -3)):

    bvec = vector(RR, [k1, k2, k3])
    xvec = A \ bvec

    augmented_matrix = A.augment(bvec, subdivide=True)

    RADIUS = 6

    myplot  = implicit_plot3d(2*x + y + z == k1, (x,-RADIUS,RADIUS), (y,-RADIUS,RADIUS), (z,-RADIUS,RADIUS), color='red', opacity=0.1)
    myplot += implicit_plot3d(x - 2*y + z == k2, (x,-RADIUS,RADIUS), (y,-RADIUS,RADIUS), (z,-RADIUS,RADIUS), color='yellow', opacity=0.1)
    myplot += implicit_plot3d(x + 3*y - 2*z == k3, (x,-RADIUS,RADIUS), (y,-RADIUS,RADIUS), (z,-RADIUS,RADIUS), color='blue', opacity=0.1) 
    myplot += point3d((xvec[0], xvec[1], xvec[2]), color='black', size=100)

    myplot += line3d([(-RADIUS,0,0), (+RADIUS,0,0)], thickness=3, color='orange')
    myplot += line3d([(0,-RADIUS,0), (0,+RADIUS,0)], thickness=3, color='orange')
    myplot += line3d([(0,0,-RADIUS), (0,0,+RADIUS)], thickness=3, color='orange')

    show(myplot)

The result should look like this: image description

When I run this code in CoCalc or my own SageMath local installation, it works perfectly. However, if I try to execute this in sagecell.sagemath.org, Sage won't be willing to plot this. However, if I delete one the implicit_plot3d commands, the plot magically appears.

Can somebody explain this? Is this reproducible for other users?