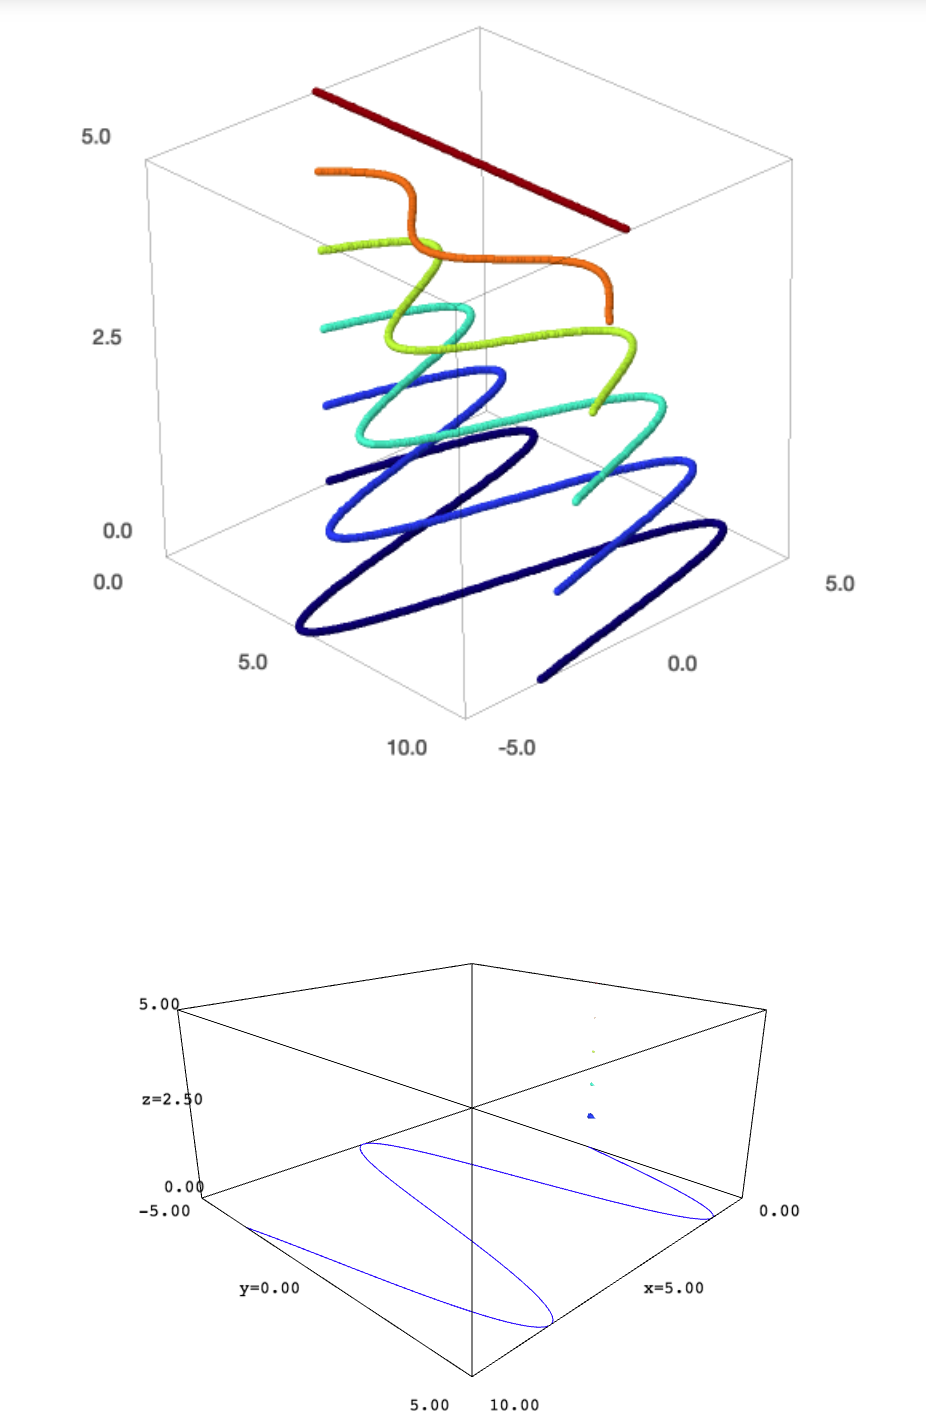
The plot3d method allows to embed 2D objects in 3D graphics. It seems to work properly with the jmol viewer. However, it fails when the viewer is threejs. For example, the code
p = sum(plot((5-k)*sin(x), 0, 10, thickness=10,
             color=colormaps.jet(50*k)).plot3d(z=k) for k in range(6))
show(p, viewer="jmol")
show(p, viewer="threejs")
yields this result:

The first graphic, corresponding to jmol, is correct. The second graphic, produced by threejs, is completely wrong.


