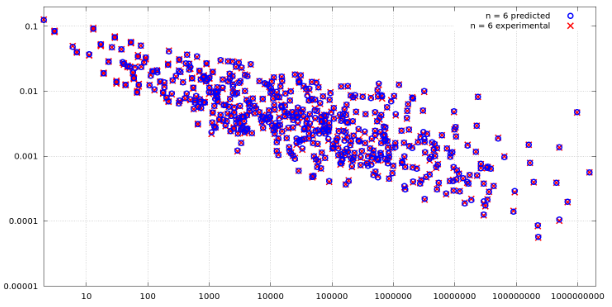
I'm performing some simulations, and end the end I have a CSV file with two columns. One column holds the theoretically expected values, and the other column holds the values obtained by the simulation. I was planning to plot something like this:

But that does not look good in my case, as the values increase normally double, so most of the points end up getting collected at the lower left part, near the intersection of x-axis and y-axis of the plot. Therefore, I need a different way to plot the numbers, which will be more visually appealing and inform how close the simulation results are to the theoretical expected ones. For example, some of my values can be seen below:
expected  = [47.9995, 95.9783, 191.9127, 383.9708, 767.8831] # partially removed for brevity
simulated = [48, 96, 191.8, 383.8, 767.4] # partially removed for brevity
What is a good way to plot such that double all the time, and to view how similar the two datasets actually are?

