How to make these histogram bars symmetric around its value?
How to make these (integer-valued) histogram bars symmetric?
The output of
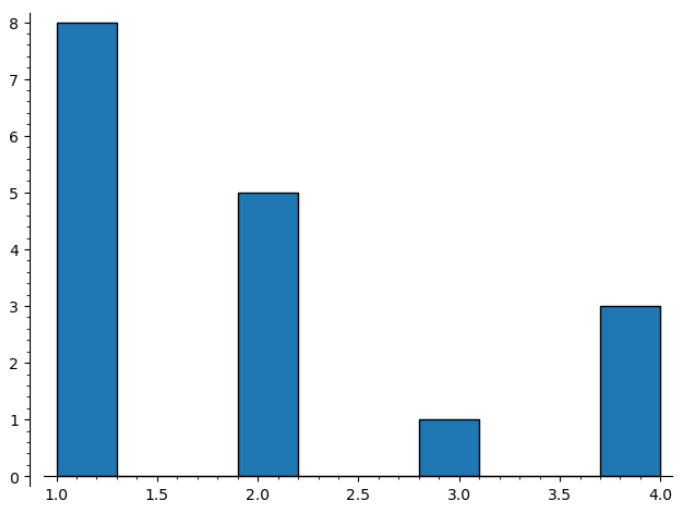
sage: histogram([1,1,1,1,1,1,2,1,1,2,2,2,2,4,4,3,4])
is the plot below at whose. The bar at 1 is not centered, but shifted to the right;
the bar at 4 is shifted to the left; the middle ones show milder shifts,
My primitive solution is to replace (don't laugh) by
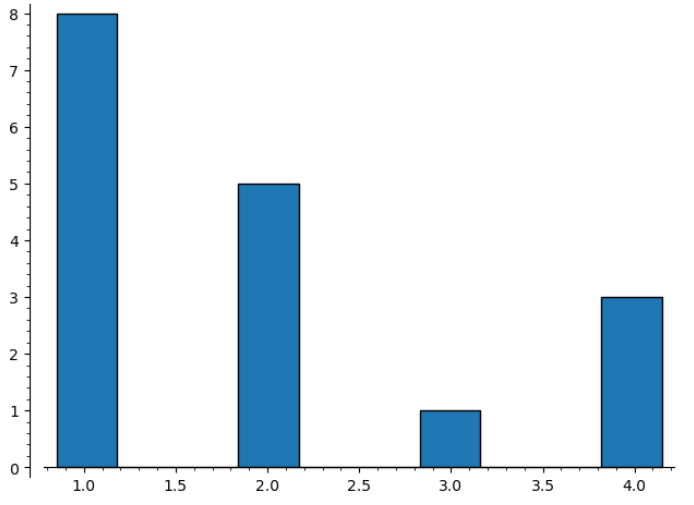
histogram([.85,.85,.85,.85,.85,.85,2,.85,.85,2,2,2,2,4.15,4.15,3,4.15])
to get what I wish:
How to do this properly?

As far as I can tell this uses
matplotlib.pyplot.histwhich has the same issue, so you might want to ask thematplotlibpeople.Many thanks! I'll do.