The acyclic orientations function behaves unexpectedly
I need all of the acyclic orientations of an input graph.
There is a handy function
acyclic_orientations()
which is meant to return an iterator for the acyclic orientations which, when asked, will return a digraph representing the "next" acyclic orientation.
But I am not sure what it is actually doing because it seems to be producing the same acyclic orientation multiple times.
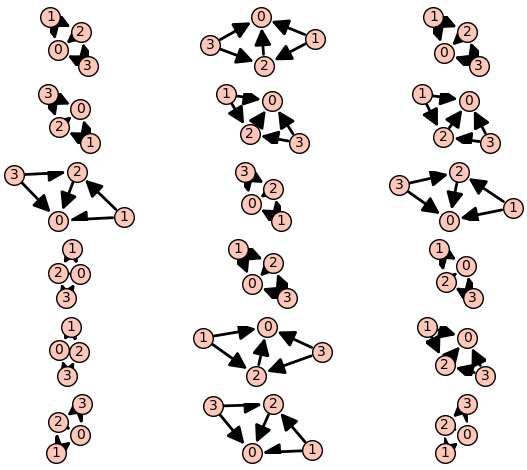
g = Graph([(0,1),(1,2),(2,3),(3,0),(0,2)])
for d in g.acyclic_orientations():
    print(d.edges(labels=false))

[(1, 0), (1, 2), (2, 0), (3, 0), (3, 2)]
[(1, 0), (1, 2), (2, 0), (3, 0), (3, 2)]
[(1, 0), (1, 2), (2, 0), (3, 0), (3, 2)]
...
...
[(1, 0), (1, 2), (2, 0), (3, 0), (3, 2)]
It produces 18 identical lines. There are actually 18 acyclic orientations of this graph, and so the number is at least correct, but I would like to it actually return the correct orientations.
For very small graphs, I can avoid this problem by using the function
orientations()
which produces every orientation and then extract the acyclic ones.
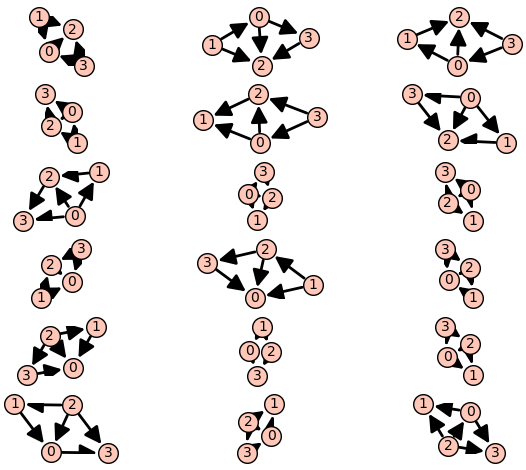
g = Graph([(0,1),(1,2),(2,3),(3,0),(0,2)])
for d in g.orientations():
    if d.all_simple_cycles() == []:
        print(d.edges(labels=false))

[(0, 1), (0, 2), (0, 3), (1, 2), (2, 3)]
[(0, 1), (0, 2), (0, 3), (1, 2), (3, 2)]
[(0, 1), (0, 2), (0, 3), (2, 1), (2, 3)]
...
...
[(1, 0), (2, 0), (2, 1), (3, 0), (3, 2)]

Just a side note: instead of
d.all_simple_cycles() == [], it's more efficient to checkd.is_directed_acyclic().Thanks Max, I quickly looked to see if there was an is_acyclic() function but mostly wanted something just to illustrate the question.