Ask Your Question
0

vertex label not readable

asked 2024-06-24 08:44:48 +0200

anonymous user

Anonymous

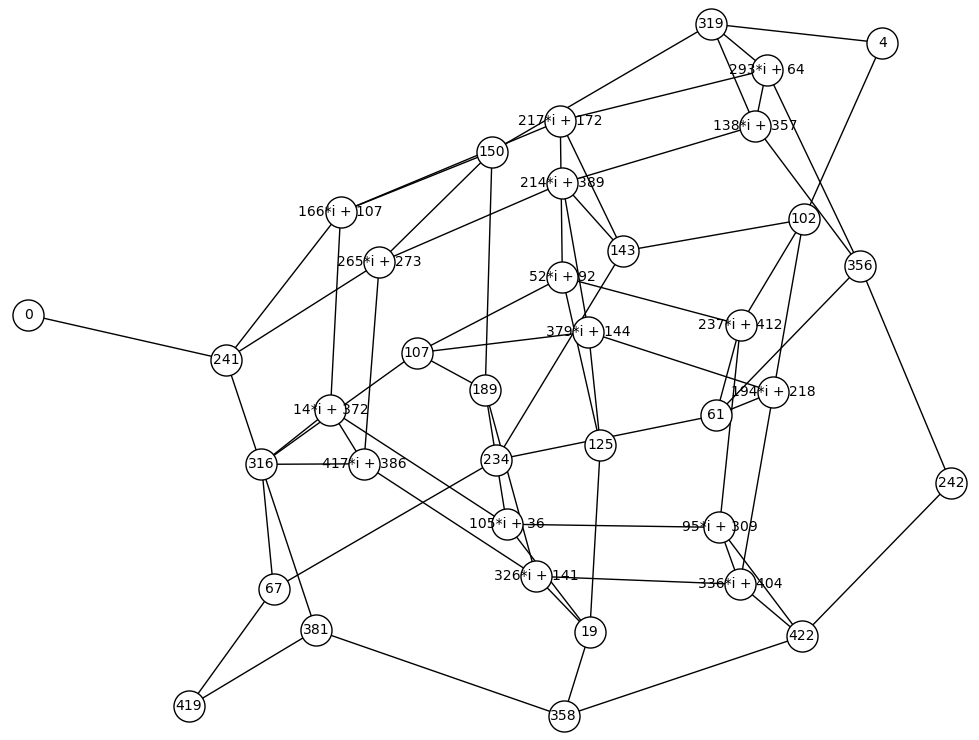
The following code generates a supersingular isogeny graph. However, Even with the parameter 'talk' the vertex name is not readable, since the vertex name is way bigger than the white area generated by 'talk' (I do not have enough karma to upload an image of it lol). I tried many other arguments in hope I could fix it, but I have to give up. Can anyone tell me how to produce a graph that looks something like this(page 10, fig 4), where the vertex size is adapted to the length of the vertex label?

def explore(G, E, done,degree):
    jE = E.j_invariant()
    G.add_vertex(jE)
    done.append(jE)
    for i in E.isogenies_prime_degree(degree):
        F = i.codomain()
        jF = F.j_invariant()
        if jF not in done:
            explore(G, F,done,degree)
        if jE != jF:
            G.add_edge(jE, jF)
    return G

degree = 3
p = 431
k = GF(p^2,'i')
E = EllipticCurve(k,[1,0])
done=[]
G=explore(Graph(), E, done,degree)
Gr=G.plot(talk=True, layout='spring', vertex_labels =True, vertex_color= 'black', figsize=10)

I would highly appreciate any help on this!

edit retag flag offensive close merge delete

1 Answer

Sort by ยป oldest newest most voted
0

answered 2024-06-24 20:55:33 +0200

Emmanuel Charpentier gravatar image

Well...

sage: Gr.show()
Launched png viewer for Graphics object consisting of 105 graphics primitives

image description

The vertices' labels are readable ; the vertices' size and shape may be perfected. See G.plot? for the various options available.

HTH,

edit flag offensive delete link more

Comments

Well yeah, this is indeed "readable", but obviously this can not be considered a "good image of the graph", since the vertex labels exceed the vertex circle. Like at the example from the link, I want to avoid this, i.e. I want a representation where the veretx name does not exceed the 'talk' area.

I actually did checked every possible option for the representation but could not find any solutions to this. Therefore I thought that there might be some work around to fix this. I would really appreciate if you could tell me how to make this graph 'good-looking'.

Wizzelgarten gravatar imageWizzelgarten ( 2024-06-27 22:06:08 +0200 )edit

Your Answer

Please start posting anonymously - your entry will be published after you log in or create a new account.

Add Answer

Question Tools

1 follower

Stats

Asked: 2024-06-24 08:44:48 +0200

Seen: 67 times

Last updated: Jun 24