Ask Your Question
1

Incorrect plot

asked 2024-05-15 04:38:41 +0100

KamBha gravatar image

I am trying to plot the following:-

show(plot(pow(x,3) - 2*pow(x, 2) - 5 * x + 6, -200, 200))

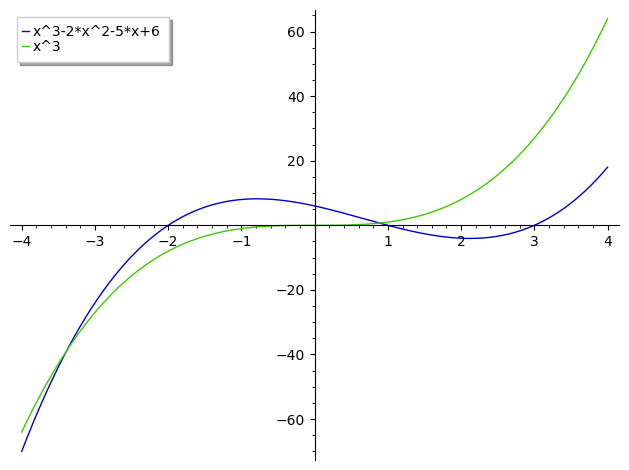
I am expecting a wavy line intersecting the x axis at -2, 1, and 3, but I am getting a graph which looks like pow(x, 3). I am not sure why it is ignoring the rest of the equation. I can plot this graph in GraphToy.

I would share pictures and links, but my karma is too low, so go to graphtoy .com and copy the following text:-

pow(x,3)-2*pow(x,2)-5*x+6

Into the first function to see what I mean.
edit retag flag offensive close merge delete

Comments

If you change the limits, you can see the roots:

show(plot(pow(x,3) - 2*pow(x, 2) - 5 * x + 6, -5, 5))
tolga gravatar imagetolga ( 2024-05-15 10:22:45 +0100 )edit

1 Answer

Sort by » oldest newest most voted
1

answered 2024-05-15 13:08:37 +0100

Emmanuel Charpentier gravatar image

updated 2024-05-15 13:26:41 +0100

In your expression, the x^3 terme dominates the other ones for large (absolute values of) x. This can be seen by computing their ratios for the limits you used :

sage: [(x^3/(-2*x^2+5*x+6)).subs(x=u).n(digits=3) for u in (-200, 200)]
[98.8, -101.]

In other words, the difference between the plot of your expression ant the plot of x^3 is way too small (1/200th of the ordinate scale) to be perceptible...

As pointed out by @tolga, restricting your plot to a small region around the roots makes this more visible :

sage: plot([x^3-2*x^2-5*x+6, x^3], (x, -3, 4), legend_label=["x^3-2*x^2+5*x+6", "x^3"])

Plot around the roots

HTH,

edit flag offensive delete link more

Comments

Still, there is an issue with the y-axis tick labels for the original range in x:

plot(x^3, -200, 200)

yields a plot with y ranging from -8 to 8, which is plain wrong! This happens both with Sage 10.3 and 10.4.beta6.

eric_g gravatar imageeric_g ( 2024-05-15 14:05:14 +0100 )edit

This long-standing issue is attri=ibutable to the fact that the scale factor (10⁶ in this case) is misplaced in the plot generation.

ISTR that the issue has already been reported and is under due consideration...

Emmanuel Charpentier gravatar imageEmmanuel Charpentier ( 2024-05-15 16:54:47 +0100 )edit
eric_g gravatar imageeric_g ( 2024-05-16 11:35:32 +0100 )edit

Your Answer

Please start posting anonymously - your entry will be published after you log in or create a new account.

Add Answer

Question Tools

1 follower

Stats

Asked: 2024-05-15 04:38:41 +0100

Seen: 230 times

Last updated: May 15