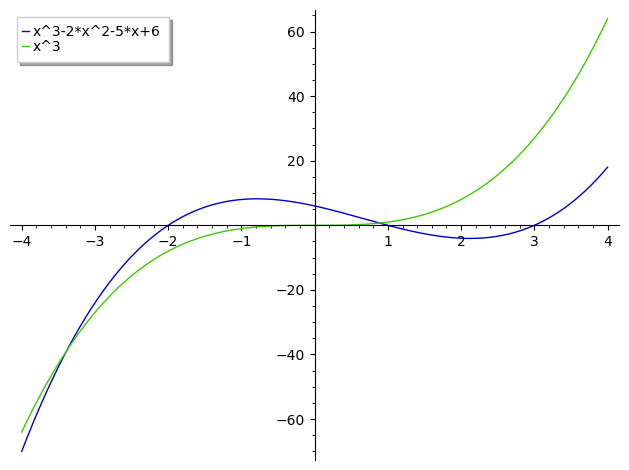
Incorrect plot
I am trying to plot the following:-
show(plot(pow(x,3) - 2*pow(x, 2) - 5 * x + 6, -200, 200))
I am expecting a wavy line intersecting the x axis at -2, 1, and 3, but I am getting a graph which looks like pow(x, 3). I am not sure why it is ignoring the rest of the equation. I can plot this graph in GraphToy.
I would share pictures and links, but my karma is too low, so go to graphtoy .com and copy the following text:-
pow(x,3)-2*pow(x,2)-5*x+6
Into the first function to see what I mean.


If you change the limits, you can see the roots: