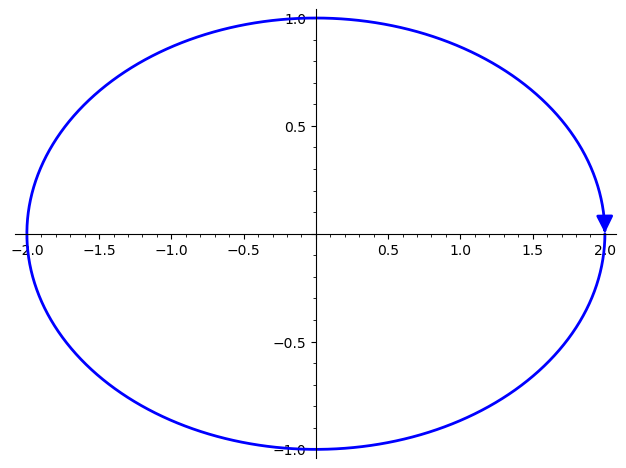
How do I use CurveArrow?
I would like to plot a parametric equation with an arrow along it, to verify that the orientation is correct. I found CurveArrow which looks like what I want, but I can't figure out how to use it.
I did
from sage.plot.arrow import CurveArrow
t=var('t')
p = parametric_plot((2*cos(-t), sin(-t)), (t, 0, 2*pi))
a = CurveArrow(p, options={})
which succeeds with no errors. However, I am not sure how to actually display the plot with the arrow. Evaluating a just prints CurveArrow from (2.0, -0.0) to (2.0, 2.4492935982947064e-16). I also tried a.show(), resulting in AttributeError: 'CurveArrow' object has no attribute 'show', and I tried (p+a).show(), resulting in TypeError: other (=CurveArrow from (2.0, -0.0) to (2.0, 2.4492935982947064e-16)) must be a Graphics objects.
I'm using Sage 10.3 on MacOS under Jupyter.
Bonus: it looks like this would just plot one arrow at the beginning or ending point of the curve. Is there a simple way to plot several arrows at various points along the curve?


