Ticks formatter rounding
Hi all,
On sage 10.0, the code
var('x,y')
f(x,y) = sqrt(x^2 + y^2)
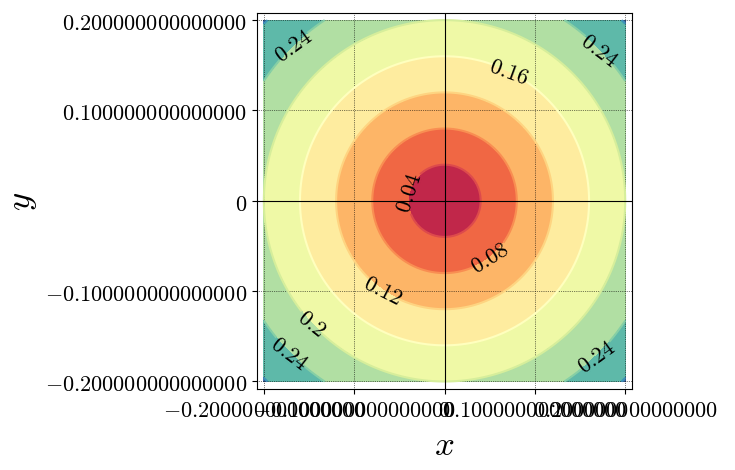
C = contour_plot(f ,(-0.2,0.2), (-0.2,0.2), axes = True, cmap = "Spectral",
labels = True, label_fmt=lambda x: "$%s$"%round(x,2), label_colors="black",
label_inline=True,
label_fontsize=16,
gridlines=True, axes_labels=["$x$","$y$"],
ticks = [[-0.2,-0.1,0,0.1,0.2],[-0.2,-0.1,0,0.1,0.2]],
tick_formatter = "latex", fontsize= 16)
produces a figure in which the ticks markers are more like -0.200000000000, see the figure. I cannot figure out how to print a nice -0.2 (using latex) instead.
Any ideas? Thanks in advance!
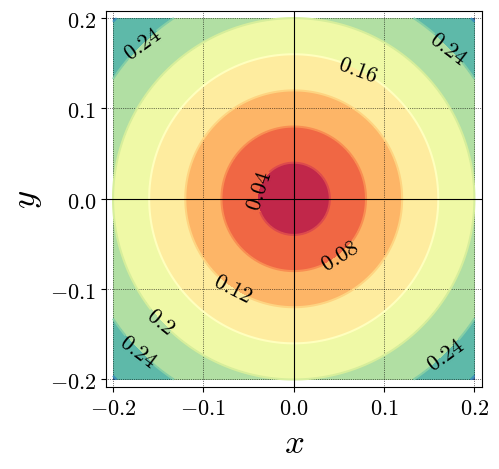

as a workaround I suggest this, but it does not quite answer your question :