plotting ill-conditionned function
Inspiration here.
Let $f(x)\,=\,\displaystyle{\frac{d}{dx}\,\log\left(\tan\left(\frac{1}{2} \, \pi \tanh\left(x\right)\right)\right)}$.
sage: f
x |--> -1/2*pi*(tan(1/2*pi*tanh(x))^2 + 1)*(tanh(x)^2 - 1)/tan(1/2*pi*tanh(x))
The inspiring question showed that $\lim_{x\rightarrow\infty}=2$. However, computing values of this function for "moderately large" $x$ values is problematic :
sage: [[u, f(u).n()] for u in (5, 10..30)]
[[5, 1.99990923138165],
 [10, 1.99999996314183],
 [15, 1.99985733718347],
 [20, -0.000000000000000],
 [25, -0.000000000000000],
 [30, -0.000000000000000]]
Trying to plot this illustrates a problem with computing these values
sage: plot(f, (1, 30))
Launched png viewer for Graphics object consisting of 1 graphics primitive
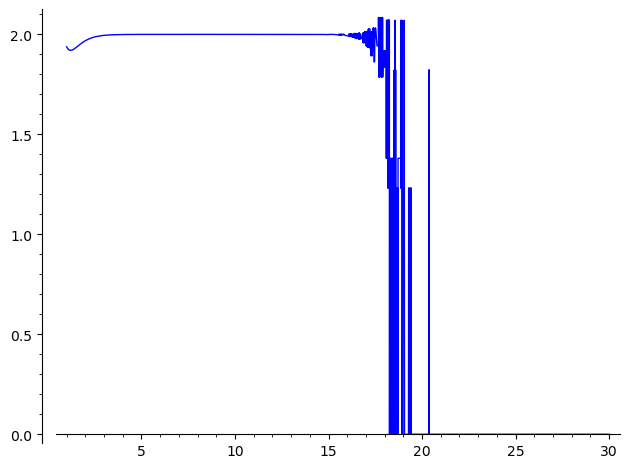
The computation is numerically unstable for n>15. One possible workaround is to force a large numerical precision:
sage: [[u, RR(f(u).n(digits=30))] for u in (5, 10..30)]
[[5, 1.99990923138260],
 [10, 1.99999999587769],
 [15, 1.99999999999981],
 [20, 1.99999999999999],
 [25, 1.99999999944971],
 [30, 1.99999483984586]]
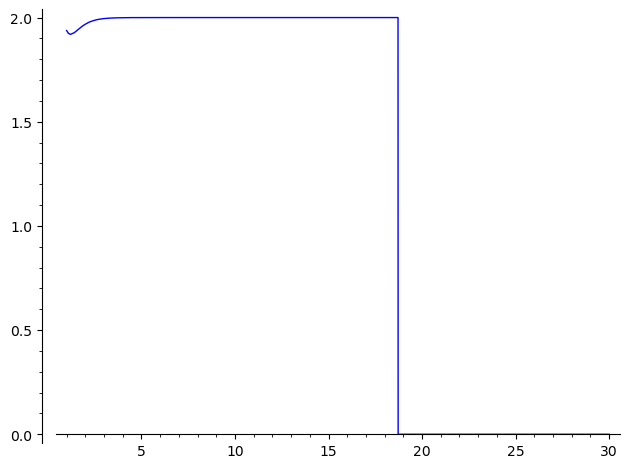
However, this forcing does not happen when plotting the values : the numerical instability is somehow masked but large values are incorrect :
sage: plot(lambda u:RR(N(f(u), digits=30)), (1, 30)) Launched png viewer for Graphics object consisting of 1 graphics primitive
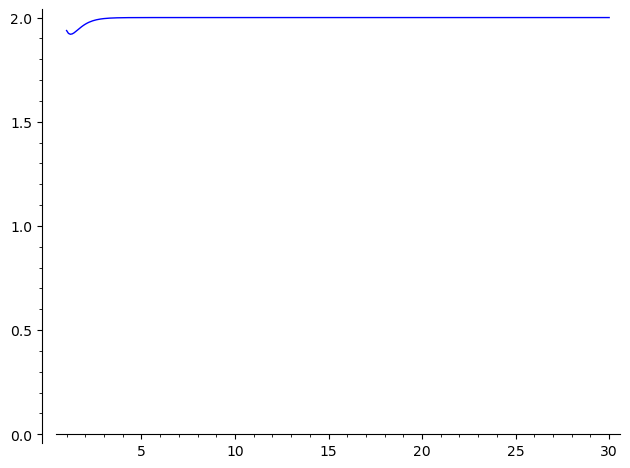
This problem seems specific to plot : computing manually a list of points works as expected :
sage: L=[u for u in (1,11/10..30)]
sage: LP=list(zip(L, map(lambda u:RR(N(f(u), digits=30)), L)))
sage: line2d(LP, ymin=0)
Launched png viewer for Graphics object consisting of 1 graphics primitive
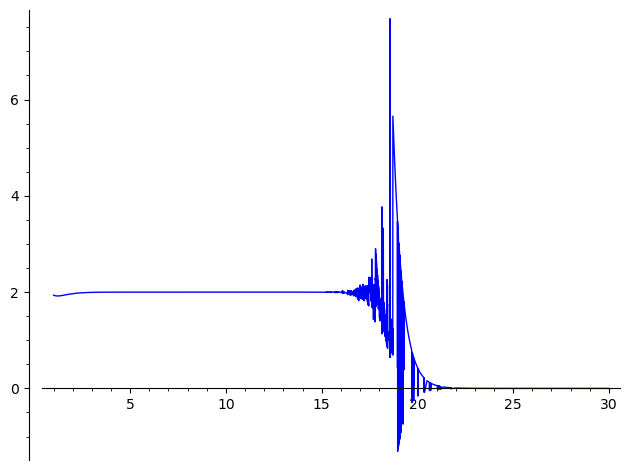
One should note that using other forms of $f(x)$, as worked out in the inspiring question, leads to different numerical instabilities in the same region :
sage: plot(f.trig_reduce().trig_simplify().trig_reduce(), (1, 30))
Launched png viewer for Graphics object consisting of 1 graphics primitive
I also tried to define a symbolic function, a Python function and a Cython functin doing the same computation with forced precision, to no avail...
Hence the questions:
Why does
plotignores the specification of precision ?Is there a workaround ?
Bonus questions :
What is the cause of this numerical instability ?
can this problem be diagnosed algorithmically (and possibly cured by forcing higher precision in umerically instable region, in a way close to what "detect_poles` do) ?
is there a better form of $f$ allowing a better numerical approximation in the questionable region ?
Any hint welcome !
