Ask Your Question
1

Parametric surface with the range of one variable depending on the other variable

asked 2022-07-07 13:15:47 +0200

alkarhythm gravatar image

updated 2022-07-07 17:52:14 +0200

slelievre gravatar image

I want to plot surface f(x,y) below

f(x, y) = x^2
x = r*cos(theta)
y = r*sin(theta)
(theta, 0, 2*pi)
(r, 0, 1 - cos(theta))

I tried this:

theta, r = var('theta r')
x = r*cos(theta)
y = r*sin(theta)
parametric_plot3d((x, y, x^2), (theta, 0, 2*pi), (r, 0, 1 - cos(theta)))

but it results in an error.

In Wolfram, i can plot this surface by this code below.

x = r*Cos[t]
y = r*Sin[t]

ParametricPlot3D[
    {x, y, x^2},
    {t, 0, 2*Pi},
    {r, 0, 1 - Cos[t]}
]
edit retag flag offensive close merge delete

Comments

Welcome to Ask Sage! Thank you for your question.

slelievre gravatar imageslelievre ( 2022-07-07 13:44:41 +0200 )edit

Thanks for correcting the title :)

alkarhythm gravatar imagealkarhythm ( 2022-07-07 14:36:38 +0200 )edit

2 Answers

Sort by » oldest newest most voted
1

answered 2022-07-13 20:20:10 +0200

Juanjo gravatar image

updated 2022-07-13 20:44:32 +0200

Although @slelievre has solve the question, I would like to provide some additional solutions in terms of the plot3d function which may be helpful.

First solution

This is essentially a rewrite of @slelievre code by replacing parametric_plot3d by plot3d:

var("z,t,θ")
r = t*(1-cos(θ))
Cyl = (r*cos(θ),r*sin(θ),z)
plot3d(r^2*cos(θ)^2, (t,0,1), (θ,0,2*pi), transformation=Cyl, 
       plot_points=[10,120])

Please note that, in cylindrical coordinates, the surface is $z=r^2\cos(\theta)^2$.

Second solution

You can plot a function whose value is NaN outside the domain. The corresponding points will not appear in the graphic:

var("z,r,θ")
Cyl = (r*cos(θ),r*sin(θ),z)
def fun(r,θ):
    if r<=1-cos(θ):
        return r^2*cos(θ)^2
    else:
        return NaN
plot3d(fun, (r,0,2), (θ,0,2*pi), transformation=Cyl, 
       plot_points=[100, 300])

The problem of this approach is that the surface boundary appears too much jagged.

Third solution

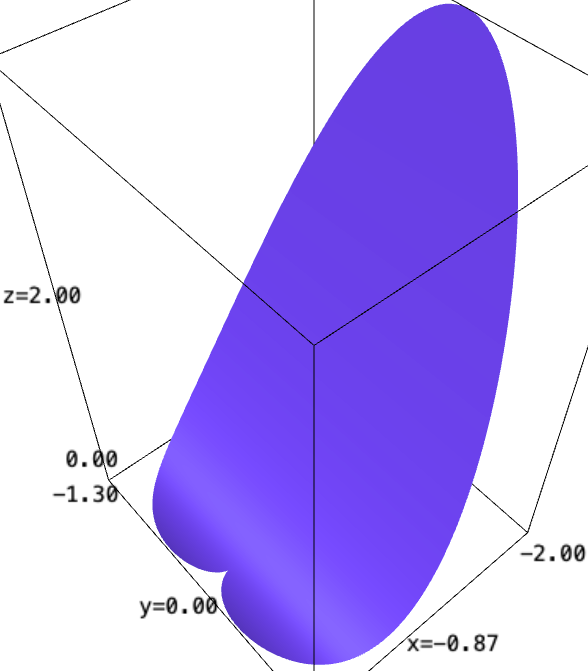
You can plot the surface in a bigger domain and then remove the unwanted part:

var("x,y,z")
fig = plot3d(x^2, (x,-2,2), (y,-2,2))
cond = lambda x,y,z: sqrt(x^2+y^2) <= 1-cos(arctan2(y,x))
fig = fig.add_condition(cond)
show(fig)

In cartesian coordinates, the surface is $z=x^2$. One has to keep only those points $(x,y,z)$ whose cylindrical coordinates $(r,\theta,z)$ satisfy the condition $r\leq 1-\cos(\theta)$, which can be expressed in cartesian coordinates as $$ \sqrt{x^2+y^2}\leq 1-\cos(\operatorname{arctan2}(y,x)). $$ The three solutions can be seen in this SageMath cell, painted in red, green and blue.

edit flag offensive delete link more
1

answered 2022-07-07 17:50:17 +0200

slelievre gravatar image

Sage lacks support for plotting parametric surfaces $M(u, v)$ where the range of $v$ depends on the value of $u$.

However, a workaround is to use a change of variable.

For the example in the question, we can write $r = t(1 - \cos\theta)$.

Then, instead of varying $r$ in $[0, 1 - \cos(\theta)]$, vary $t$ in $[0, 1]$.

sage: t, theta = SR.var('r, theta')

sage: x = t*(1 - cos(theta)) * cos(theta)
sage: y = t*(1 - cos(theta)) * sin(theta)
sage: z = x^2
sage: xyz = (x, y, z)

sage: parametric_plot3d(xyz, (theta, 0, 2*pi), (t, 0, 1), plot_points=[360, 60])

Parametric surface plotted in Sage: cardioid cutout of a parabolic cylinder

edit flag offensive delete link more

Comments

Thank you for your answer. I could plot by your code and understand it needs to a little creative.

And thanks for the correcting the text. That is helpful (I'm a non-native).

alkarhythm gravatar imagealkarhythm ( 2022-07-08 00:28:49 +0200 )edit

Your Answer

Please start posting anonymously - your entry will be published after you log in or create a new account.

Add Answer

Question Tools

Stats

Asked: 2022-07-07 13:15:47 +0200

Seen: 340 times

Last updated: Jul 13 '22