'TypeError: unable to coerce to a real number' when trying to plot the real component of sqrt(z)
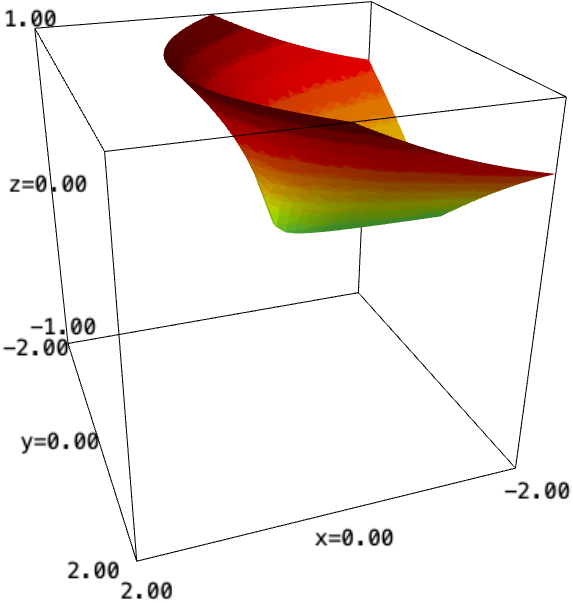
Recently I have been trying to find a way to visualise complex functions and have been using sage to automate the process, by viewing the x and y axes as Re(z) and Im(z), and the z-axis as either Re(f(z)) or Im(f(z)). I have had success plotting some complex functions, but am finding now that sqrt(z) for example, will not plot, and produces this TypeError. The code I have used to try plot the function Re(sqrt(z)) is below,
x, y, z = var('x, y, z')
z1, z2 = -1, 1
ni = 10*(z2-z1)
dz = (z2-z1)/ni
def col3(x,y,z):
  return float(0.5*dz + floor((z-z1)/dz)/ni)
surf = implicit_plot3d(z==real_part(sqrt(x+I*y), (x,-2,2), (y,-2,2), (z,-1,1), color=(col3, colormaps.jet))
show(surf, aspect_ratio[1,1,2])
I suspect the cause of the error is found in the fact that when sage calculates Re(sqrt(z)), it produces the following:sqrt(abs(x+I*y))*cos(1/2*arctan2(y, x)). Therefore I suspect that because it doesn't seem to know that abs(x+I*y) = sqrt(x^2+y^2), it assumes that the number is still complex and throws the error. So, I am wondering if there is a way for me to get sage to produce sqrt(sqrt(x^2+y^2))*cos(1/2*arctan2(y, x)) instead when I find Re(sqrt(z)) so that I can plot it.