plot_vector_field : some questions

hi
i dont really know how to do this :
i have a vectori field, say :
y=var('y')#x l'est déjà par défaut
coef=10
g = plot_vector_field((x*coef, 2*y*coef), (x,-4,4), (y,-3,3),
        gridlines=True, gridlinesstyle=dict(color="blue", linestyle=":"),
        frame=False, axes=True)
show(g)
so each point say (k.p,k'.p) with k,k' in Z and p,p choosen by sage, have a vector starting from them, represented by sage.
Now, i would like to show to my students what div and rot mean
for that purpose, i would like to :
- draw some little areas, like circles -> i think i can learn how to do that
- inside this circles i would like to put some text with the value of div and rot at the center of the circle -> also i think, if i do some research i can find
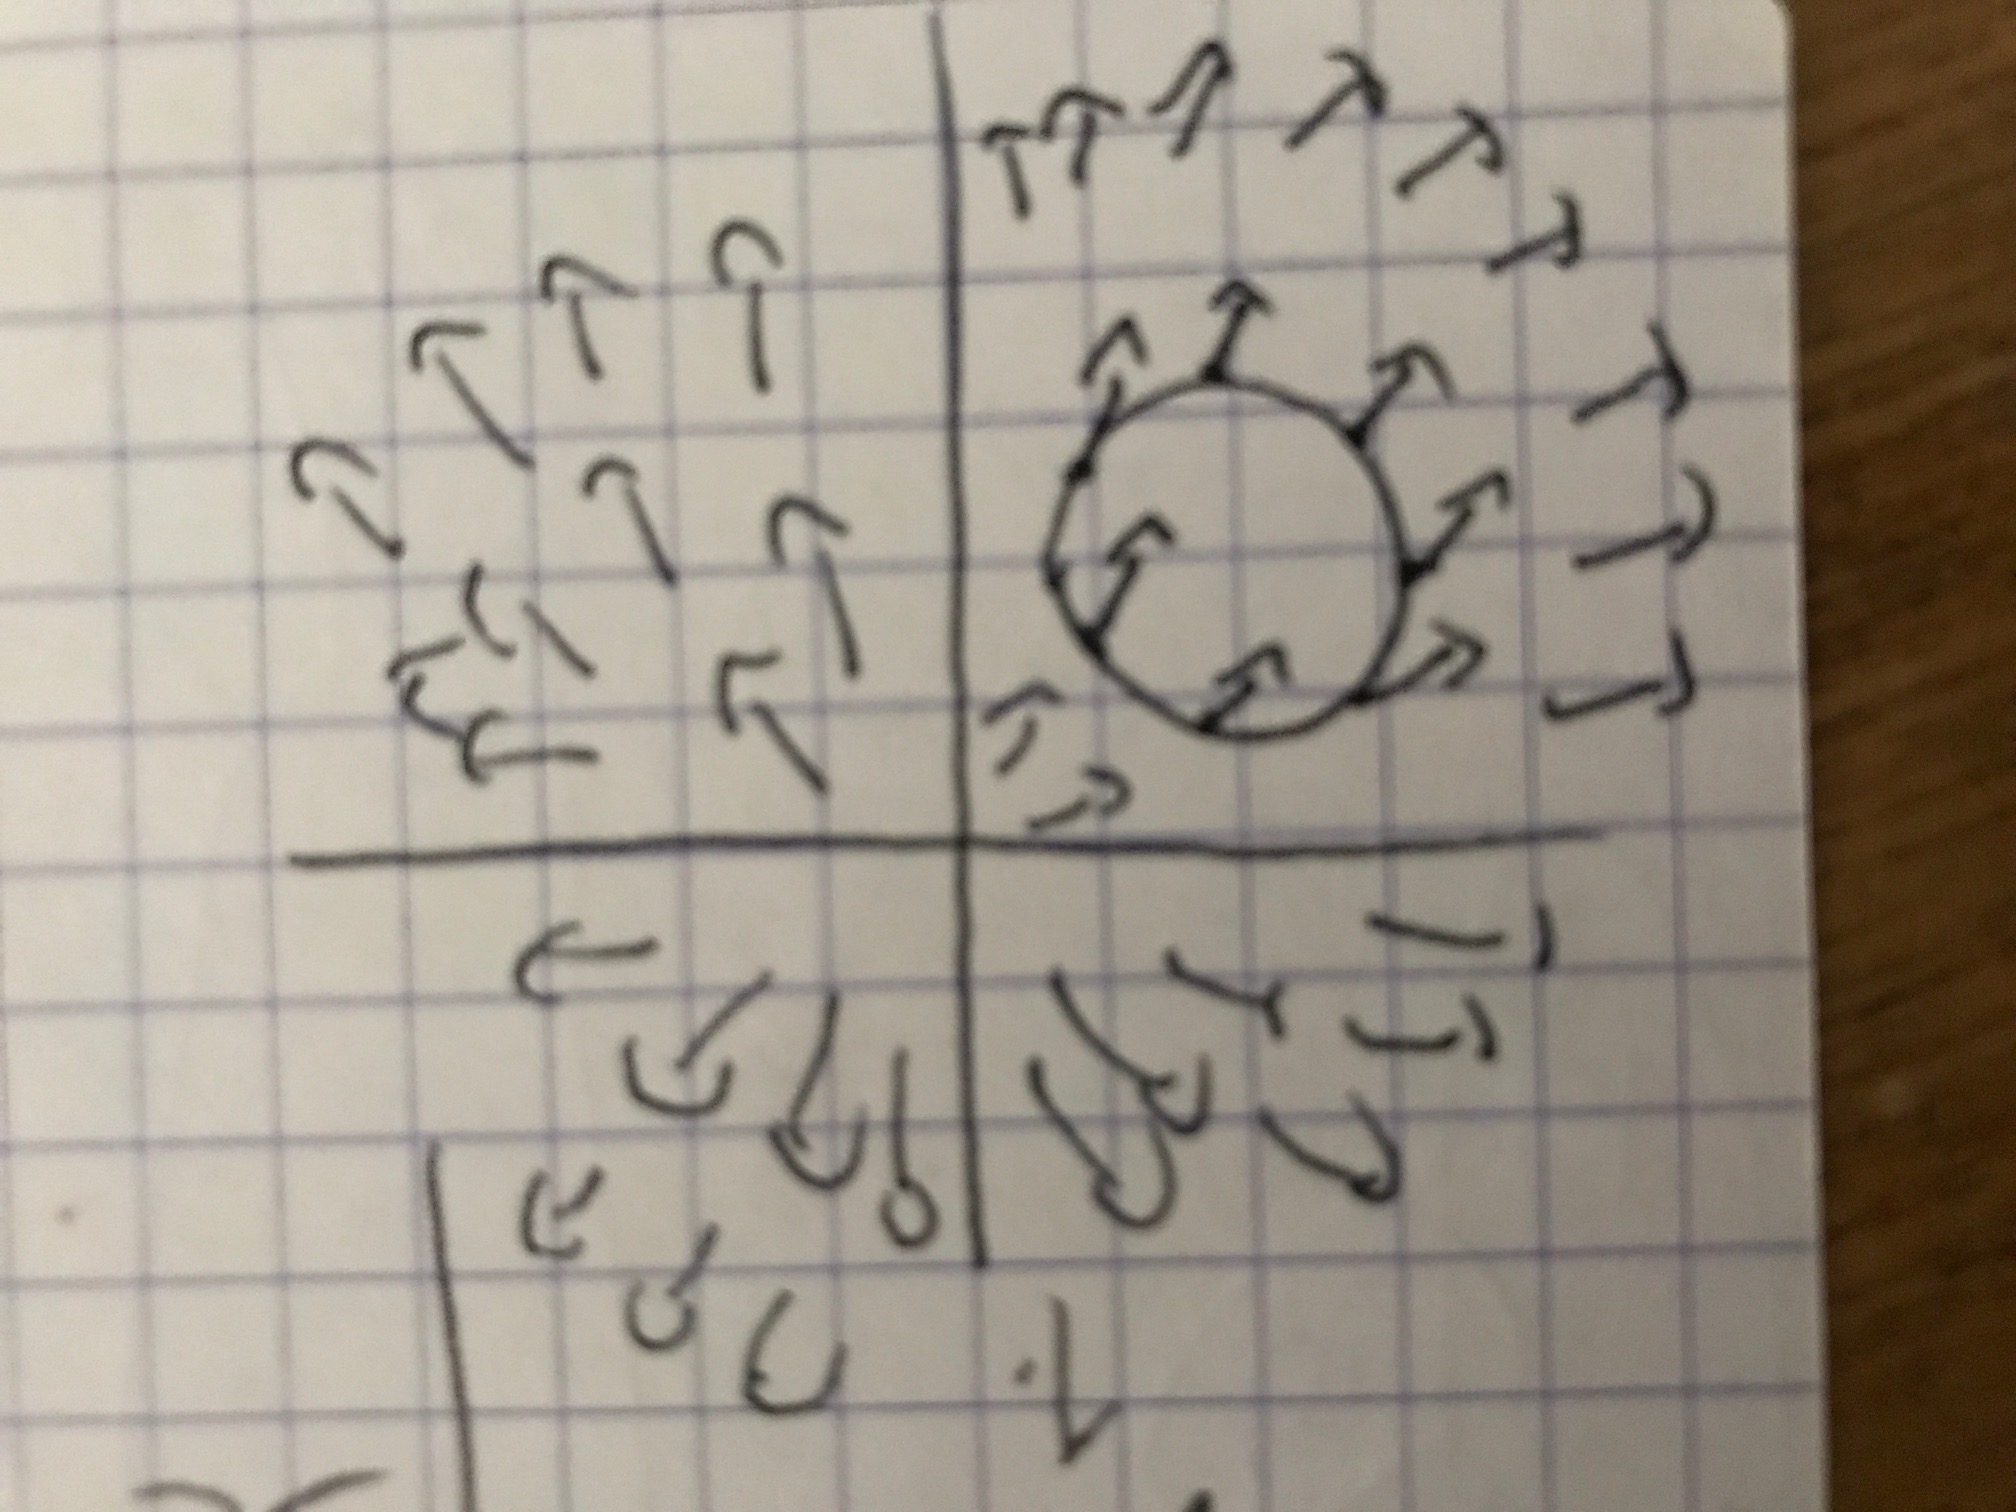
- but now, the point where i am not sure wether it is possible : i would like to modify my vectoriel field, so that no point inside the disk has its vector image represented, but a certain number of points of the circle would have their vector, as in the image C:\fakepath\aj_vect.JPG
add a comment
