Ask Your Question
1

Area under two curves

asked 2022-03-19 13:13:27 +0200

updated 2022-03-19 14:50:45 +0200

slelievre gravatar image

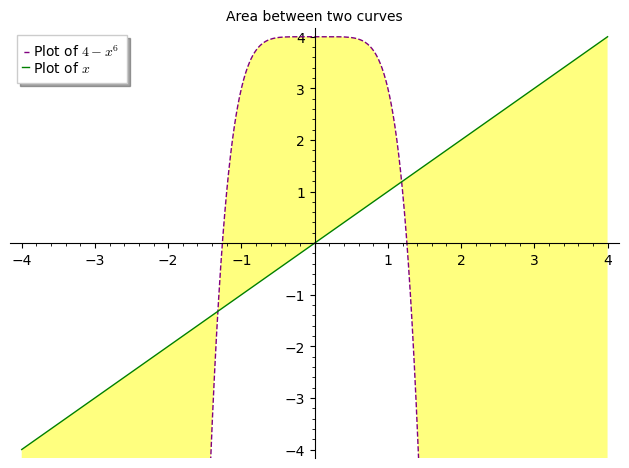
I am trying to fill in the area between two functions, $F(x) = 4-x^6$ and $G(x) = x$.

This is my code so far. It won't fill properly, it takes into consideration other areas of the functions.

f(x) = 4 - x^6
g(x) = x

P1 = plot(f, (-4, 4), color='purple', linestyle="dashed", fill=True,
          legend_label='Plot of $4-x^6$')
P2 = plot(g, (-4, 4), color='green', title="Area between two curves",
          legend_label='Plot of $x$')

show(P1 + P2, ymin=-4, ymax=4)
edit retag flag offensive close merge delete

Comments

Welcome to Ask Sage! Thank you for your question.

slelievre gravatar imageslelievre ( 2022-03-19 14:51:24 +0200 )edit

1 Answer

Sort by ยป oldest newest most voted
2

answered 2022-03-19 15:06:39 +0200

dsejas gravatar image

updated 2022-03-19 15:06:57 +0200

Hello, @Sagematherireland! You are in the right track (you almost got it done!) The fill argument for the plot command can take on the value of a function, in which case, it will fill the area between the curves. Here is an example that I believe should produce the result you expected:

f(x) = 4 - x^6
g(x) = x
P1 = plot(f, (-4,4), color='purple', linestyle='dashed', fill=g, fillcolor='yellow', legend_label='Plot of $4-x^6$')
P2 = plot(g, (-4,4), color='green', title="Area between two curves", legend_label='Plot of $x$')
show(P1+P2, ymin=-4, ymax=4)

Notice I have changed the fill=True argument to fill=g. I also used the fillcolor argument in the first plot just for fun. Here is the result: image description

Hope this helps!

edit flag offensive delete link more

Your Answer

Please start posting anonymously - your entry will be published after you log in or create a new account.

Add Answer

Question Tools

Stats

Asked: 2022-03-19 13:13:27 +0200

Seen: 125 times

Last updated: Mar 19 '22