Ask Your Question
1

Contour Plot of 1/(2*pi*sqrt(x^2 + y^2)), why is it square? How to fix it?

asked 2022-02-26 15:44:14 +0200

Tube777tube gravatar image

updated 2022-02-26 15:47:51 +0200

slelievre gravatar image

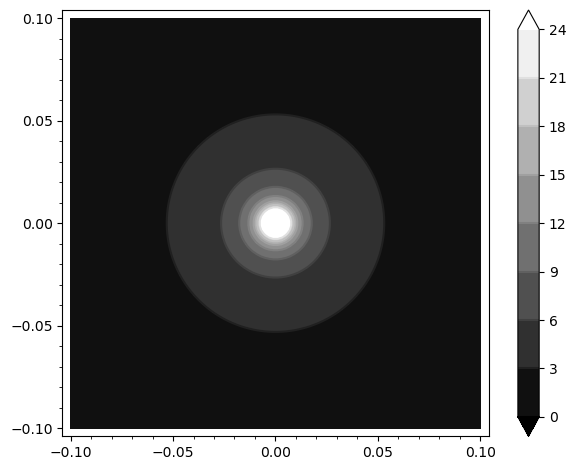
I plotted the contour plot of a function 1/(2*pi*sqrt(x^2 + y^2)).

The code is below:

contour_plot(1/2/(pi*sqrt(x^2 + y^2)), (x, -0.1, 0.1), (y, -0.1, 0.1),
             plot_points=20, colorbar=True)

The output result is not round, but square! Why?

How to fix it?

edit retag flag offensive close merge delete

1 Answer

Sort by ยป oldest newest most voted
2

answered 2022-02-26 16:49:03 +0200

rburing gravatar image

The plot_points argument affects the precision with which the plot is made; setting it low enough causes artifacts like circles appearing as squares. To get the image with those contours with more precision, you can omit the plot_points argument (or increase the value), and just pass the appropriate contours argument:

contour_plot(1/2/(pi*sqrt(x^2 + y^2)), (x, -0.1, 0.1), (y, -0.1, 0.1), contours=range(0,25,3), colorbar=True)

contours

edit flag offensive delete link more

Your Answer

Please start posting anonymously - your entry will be published after you log in or create a new account.

Add Answer

Question Tools

1 follower

Stats

Asked: 2022-02-26 15:44:14 +0200

Seen: 159 times

Last updated: Feb 26 '22